Dashboards
Predefined dashboards
The following dashboards are available as “presets” and are either global or entity-driven meaning that they will only show data related to a selected business object (such as a given execution, project…).
- PerformanceDashboard: display performance metrics of your test execution such a average response times, throughput… (the dashboard is also integrated directly to the execution performance view)
- RealtimePerformanceDashboard: Similar to the PerformanceDasbhoard with additional graphs such as the latests x measurements (only available while the execution is running , it is also integrated directly to the execution performance view)
- RTMDashboard: aka “interactive sessions” provides more flexibly as well as analytics capabilities for analyzing your execution’s results (see interactive-session)
- WikimediaDemo: provides an example of custom dashboard using external services
- ProjectOverview (Enterprise): provides an overview of the related plan and keyword executions over the last week (after applying the corresponding project entity)
- SelfMonitoring (Enterprise): provides information about the step’s internal activity and resource usage. More details here
- UserExecutionDashboard (Enterprise): offers a breakdown of user activity over the last week)
General concepts
Dashboards allow for real-time as well as historical visualisation of data in many forms (tables, charts, etc). The data may originate from step itself or foreign sources.
Dashboards are either directly integrated within step’s standard views in the form of short-lived sessions, for instance in the performance tab of the execution view:
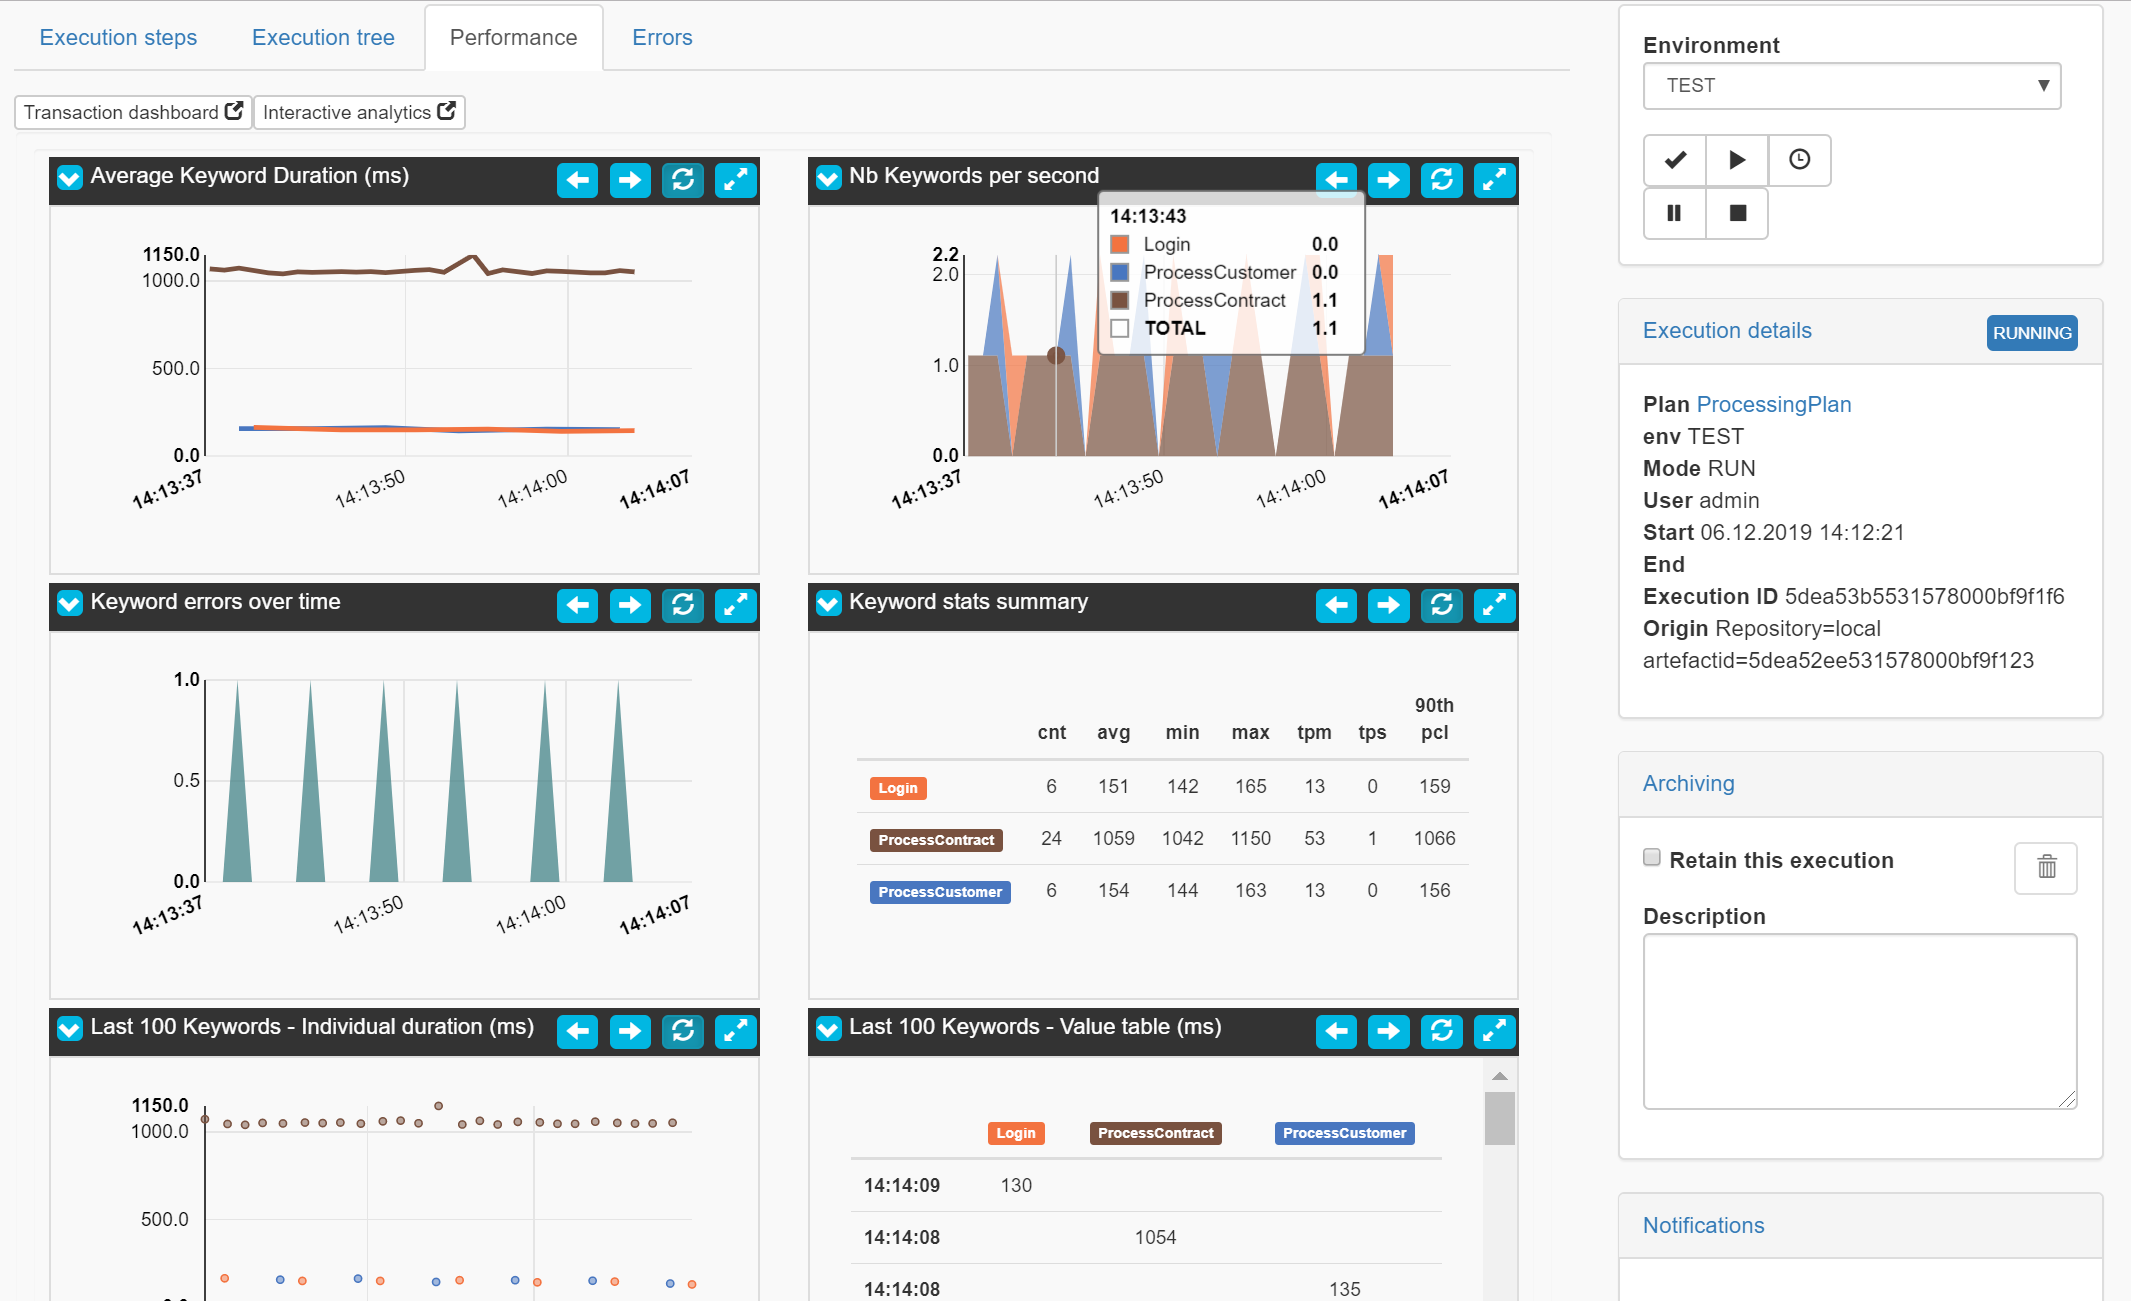
or accessed via the dedicated menu entry (“Dashboards”) in the main menu at the top:

In addition to displaying data, the dashboard tab enables users to manage their own anaylsis or monitoring sessions, create and design their own dashboards, and customize built-in dashboards (called presets) which are officially supported.
All functionality discussed throughout this page and every dashboard built into the product was achieved or designed via configurative actions only thanks to exense’s custom visualization framework. This configurative approach to dashboarding provides users with great freedom to build and customize their own monitoring or analysis views without leaving the application or having to write any code. More details about dashboard customization are provided in the custom dashboard creation section of this page.
Presets
As of v3.12.0, step comes with pre-populated dashboards which are immune to deletion. These are called “presets”. In step’s Community Edition, a couple of performance dashboard presets as well as a demo one relying on a foreign data source are provided. Additional entity-driven dashboard presets providing statistics on specific entities such as users or projects are provided in the Enterprise Edition. It also comes with a self-monitoring dashboard preset providing information about the step’s internal activity and resource usage. As an Enterprise customer, you can expect more presets to be added on a regular basis in the future. We also hope that the community will thrive to share dashboard definitions with eachother, as they can be easily encoded into a javascript file via our programmatic API.
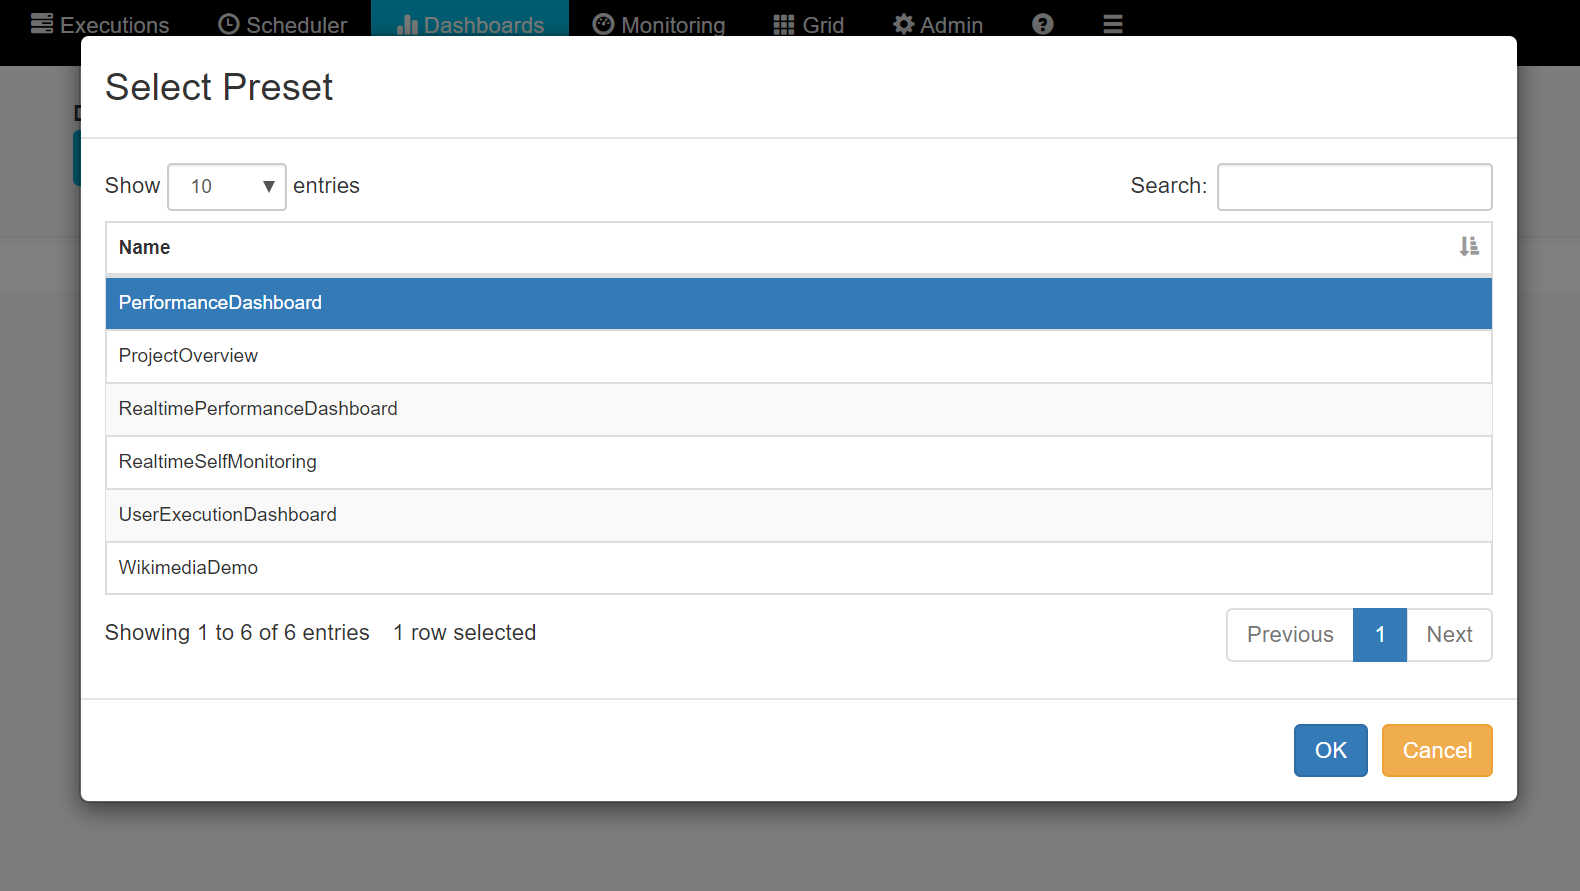
In both versions, these dashboards can be accessed via the Preset button in the right hand corner, which will pop a table displaying all of the available presets:

If you select one of the lines and click OK:
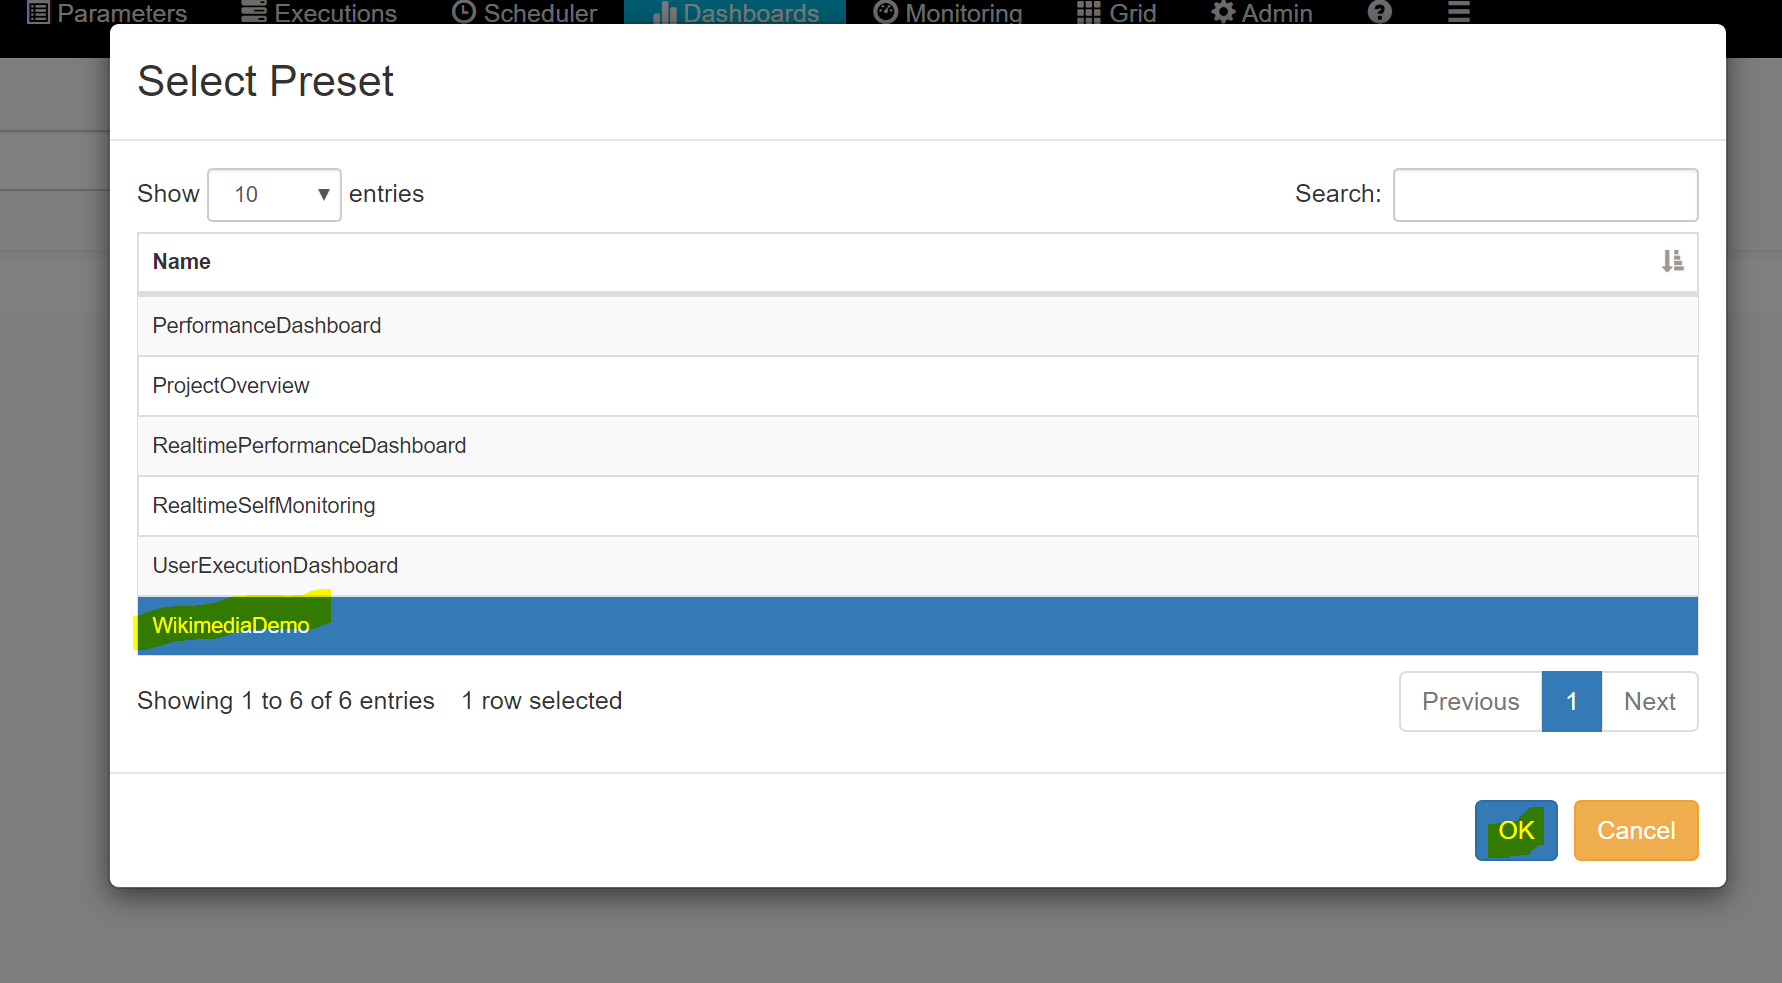
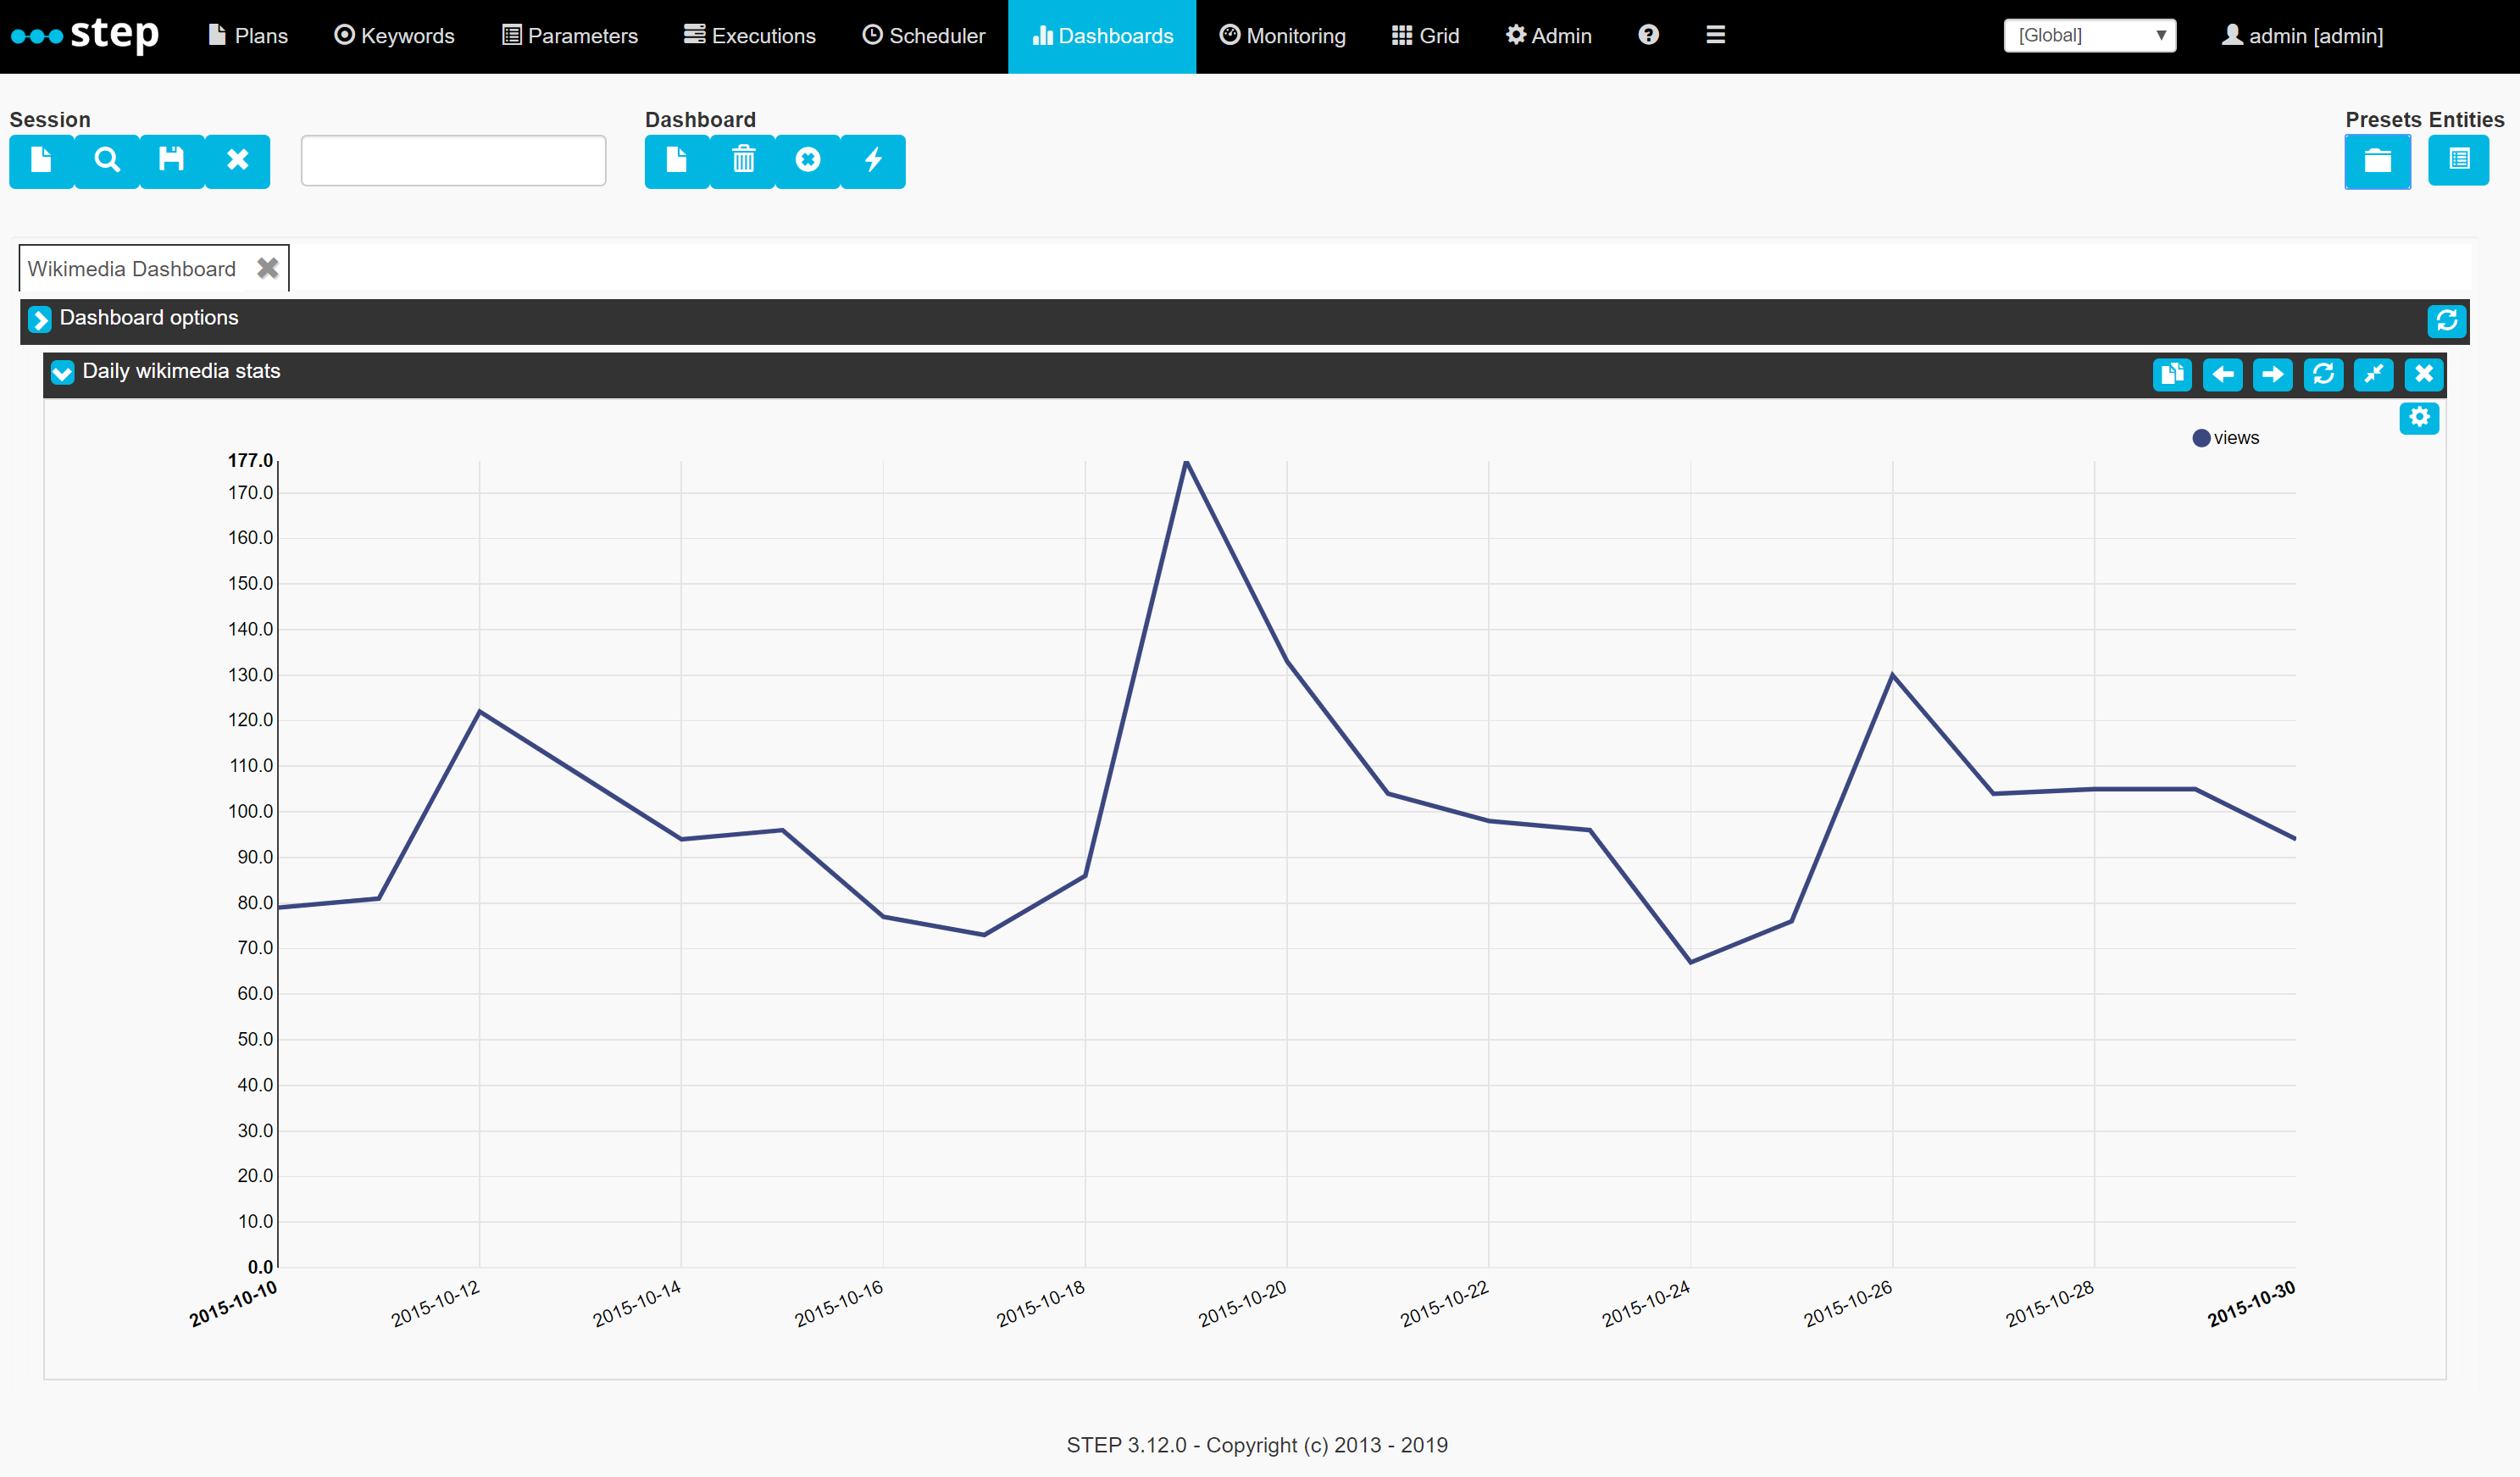
The dashboard will be loaded into your current session:
Sessions
Sessions respresent the live state of a dashboard at a specific moment. It not only contains its definition but also its data and particular display settings. After loading a preset or creating a dashboard from scratch using the Dashboard toolbox, users can save a particular session by entering a session name in the text box and clicking the save icon:
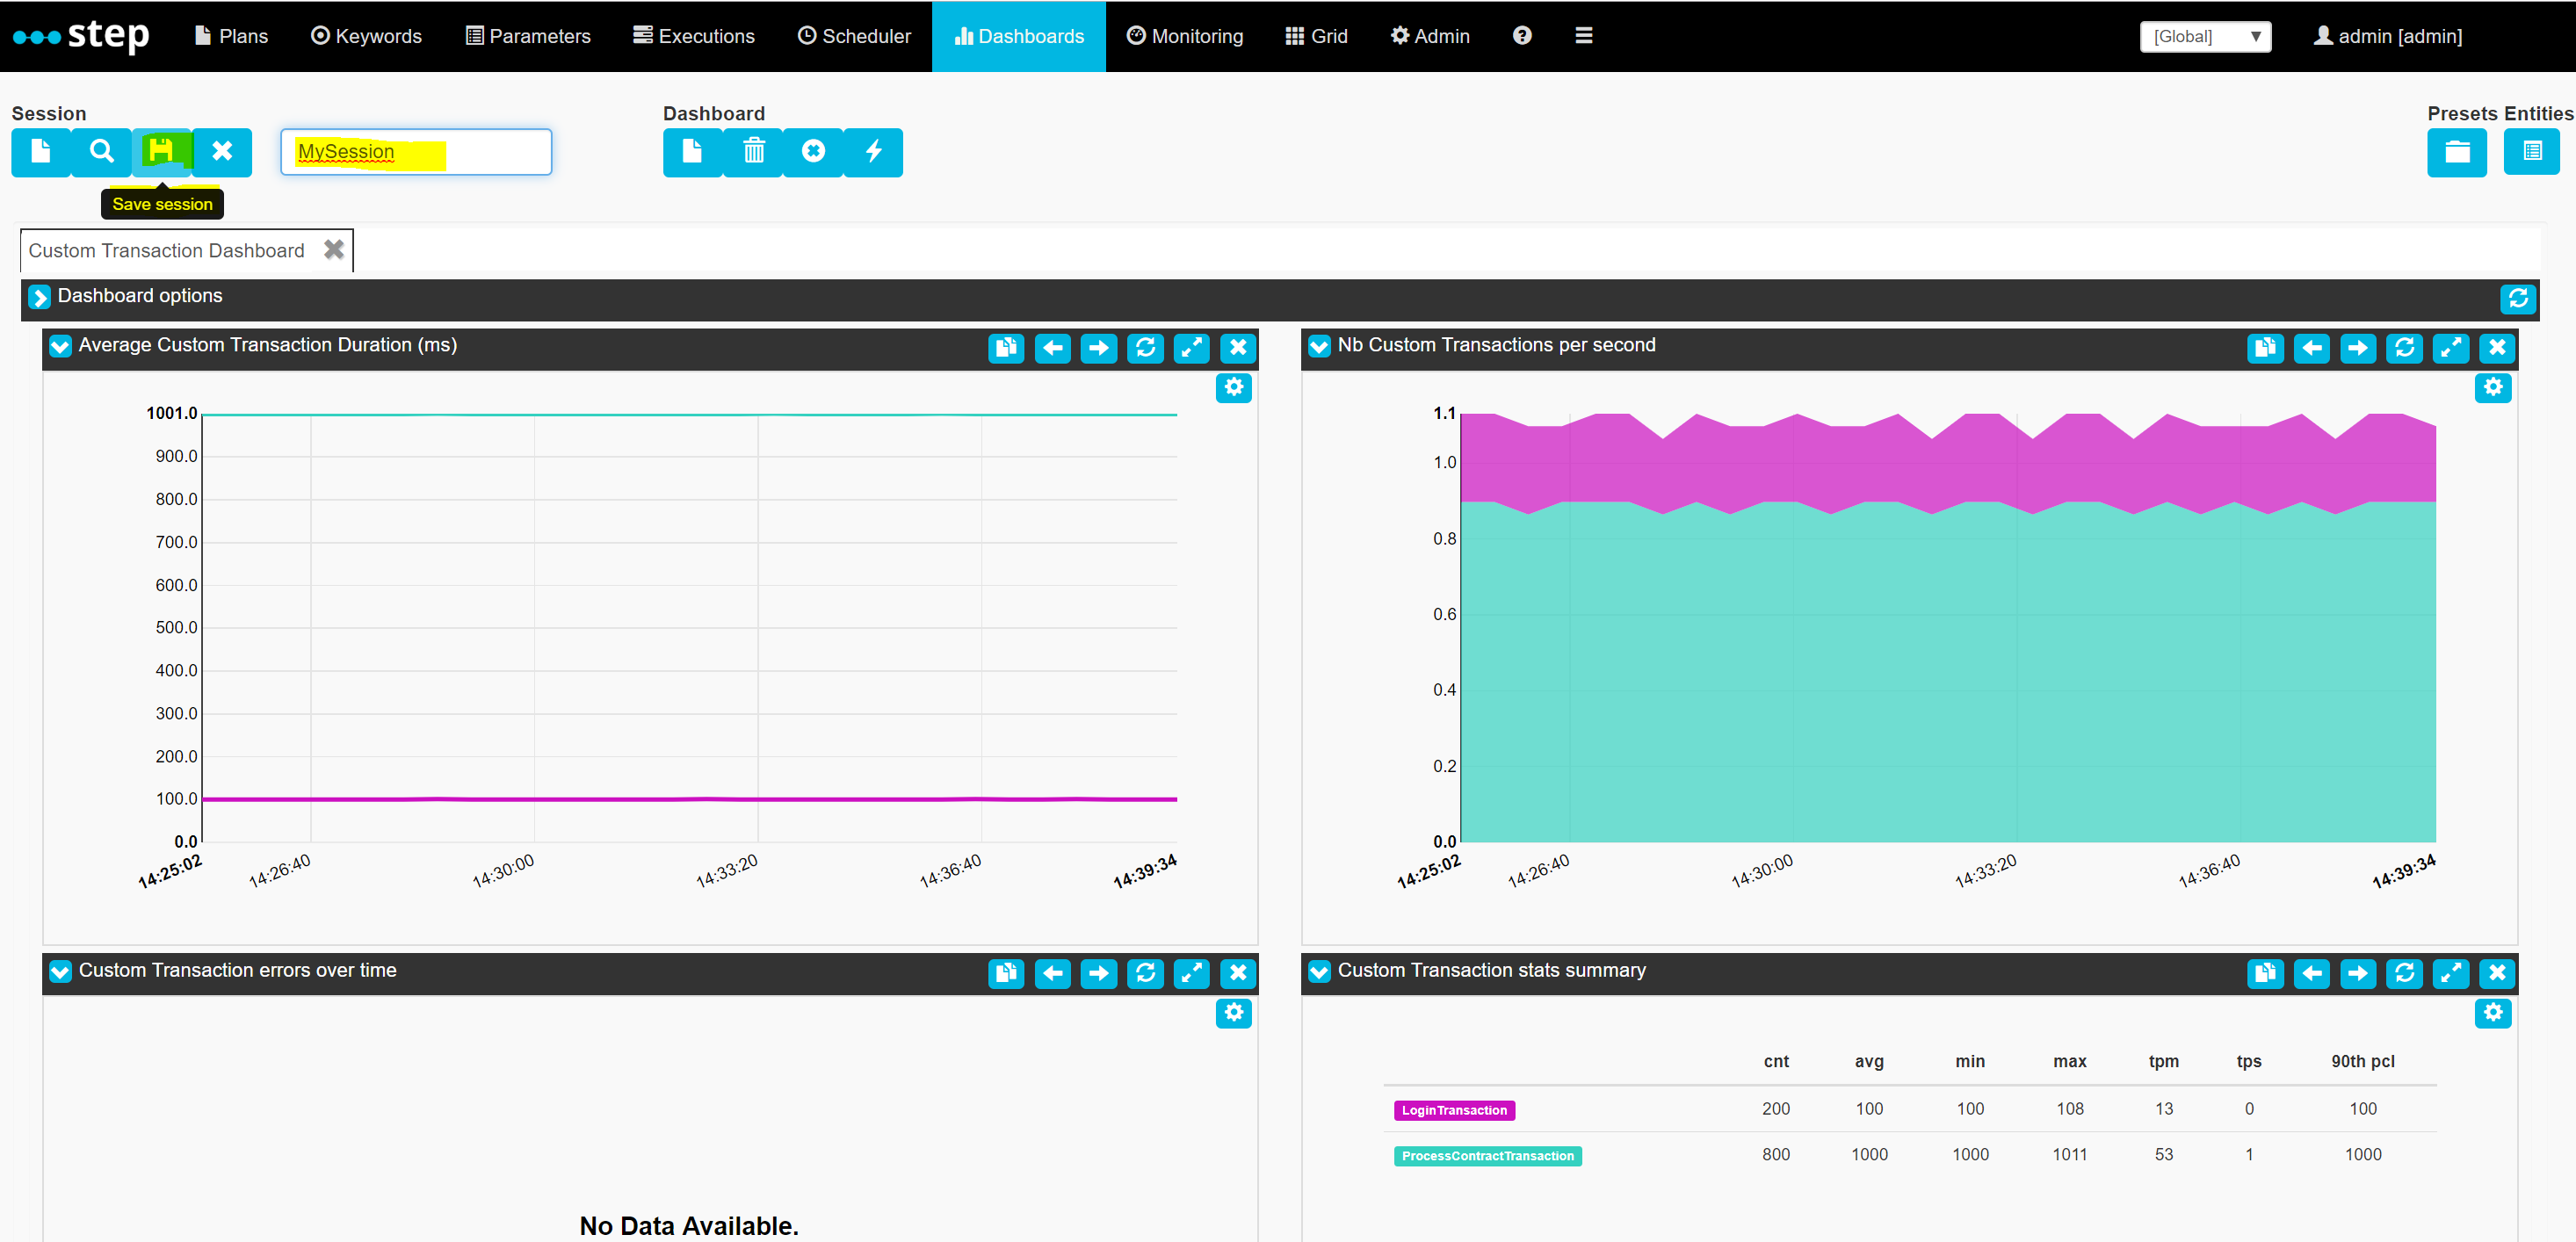
Sessions can then be deleted or re-opened by using the search and remove buttons in the Session toolbar:

Entity-driven dashboards
Certain dashboards require a business object id as an input in order to fetch the relevant data. For instance, the preset “PerformanceDashboard” requires users to select an execution in order to refresh its views with data related to that specific execution’s id.
Let’s load this preset:
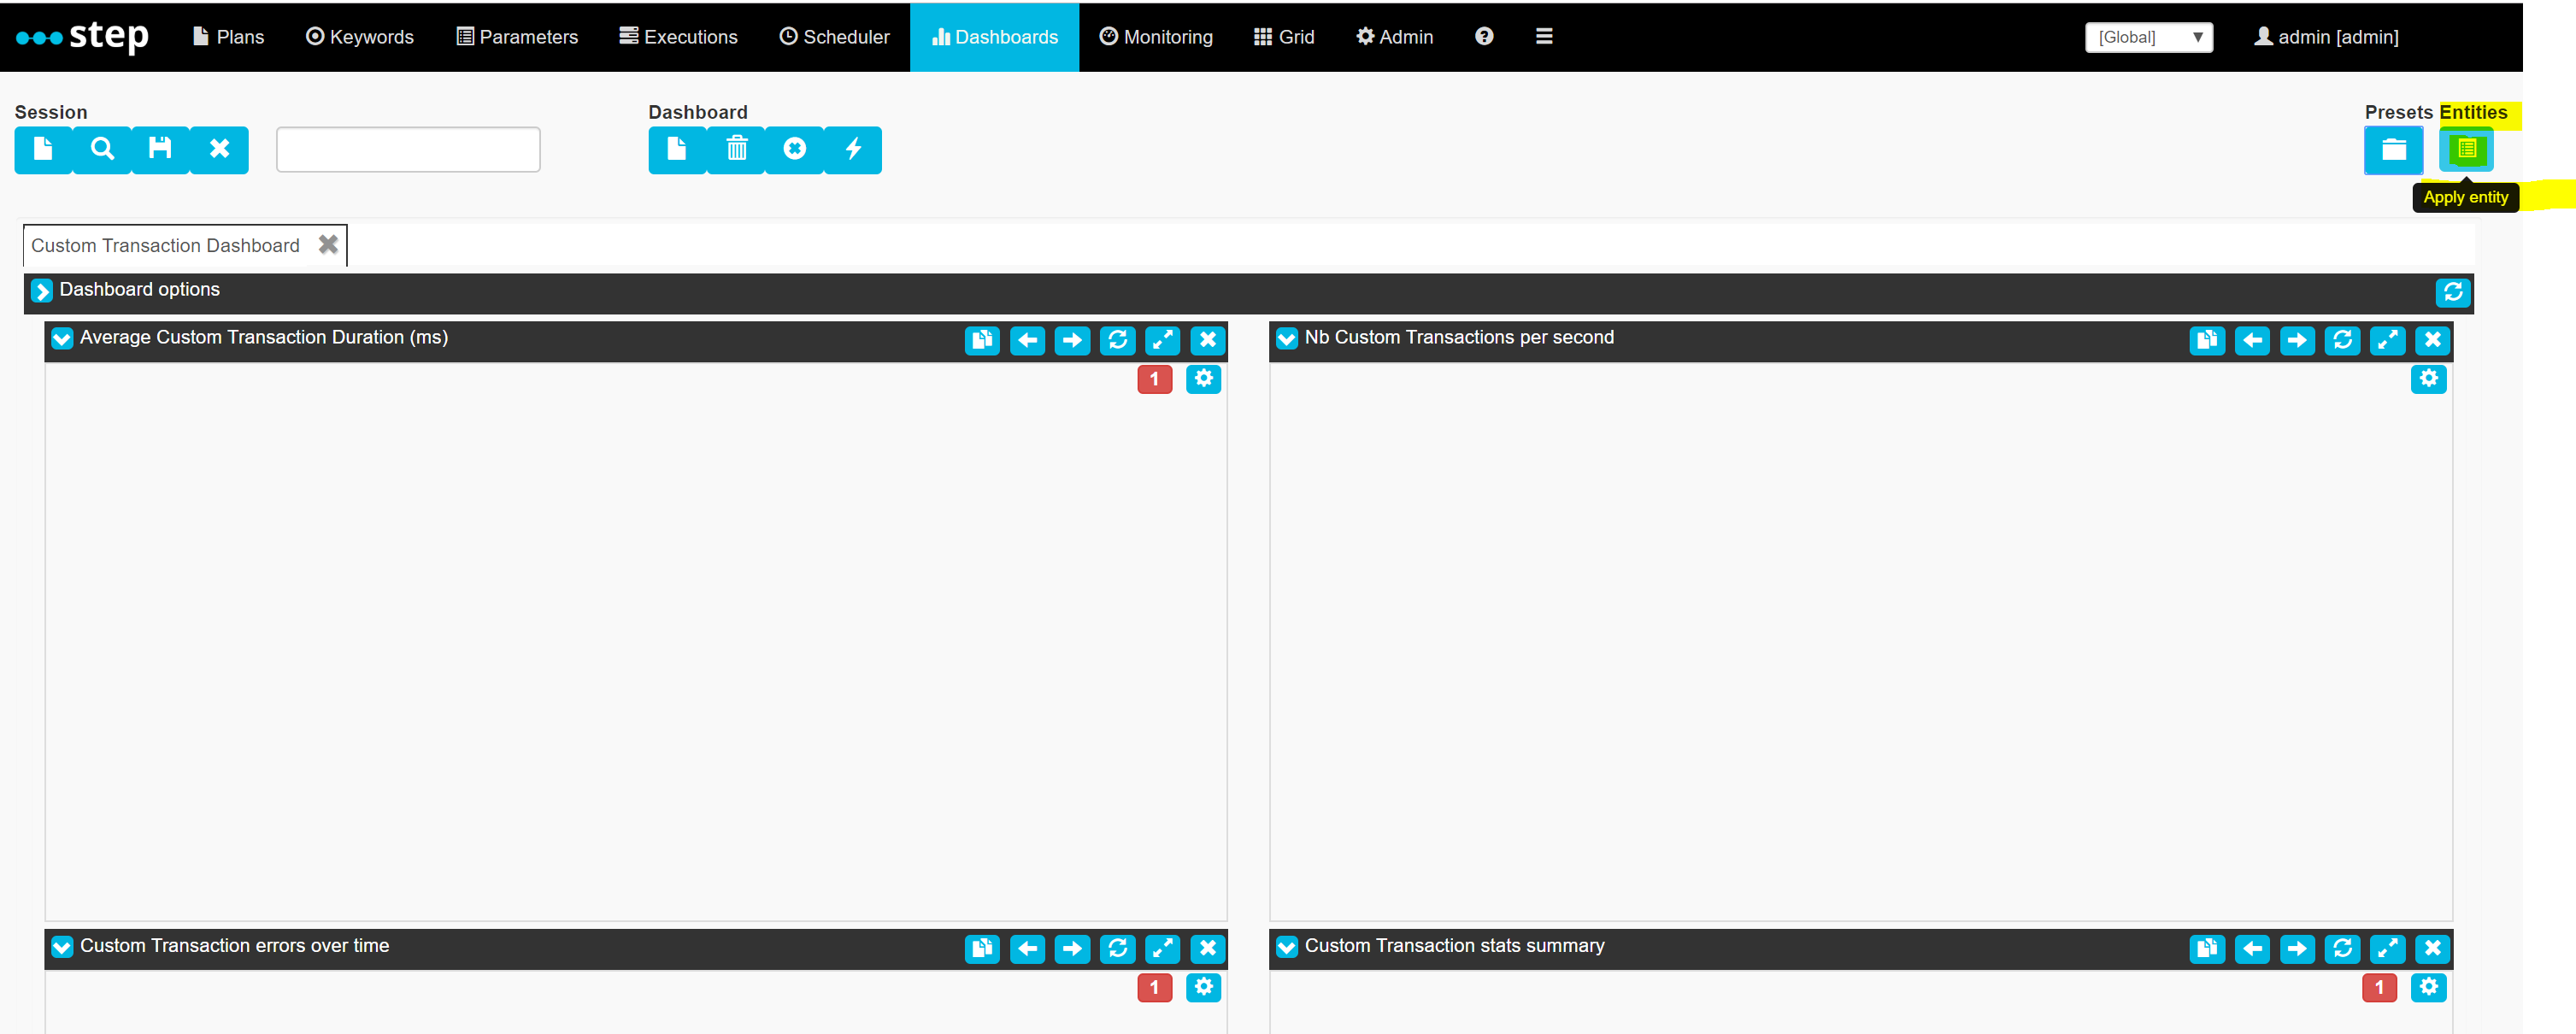
Click the Apply Entity button:
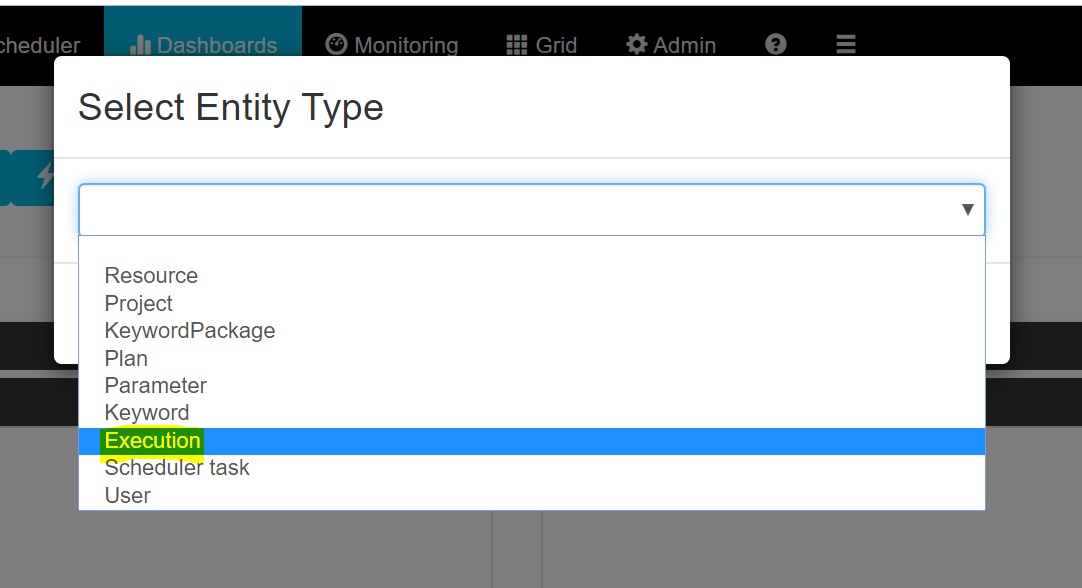
Choose the “Execution” entity type:
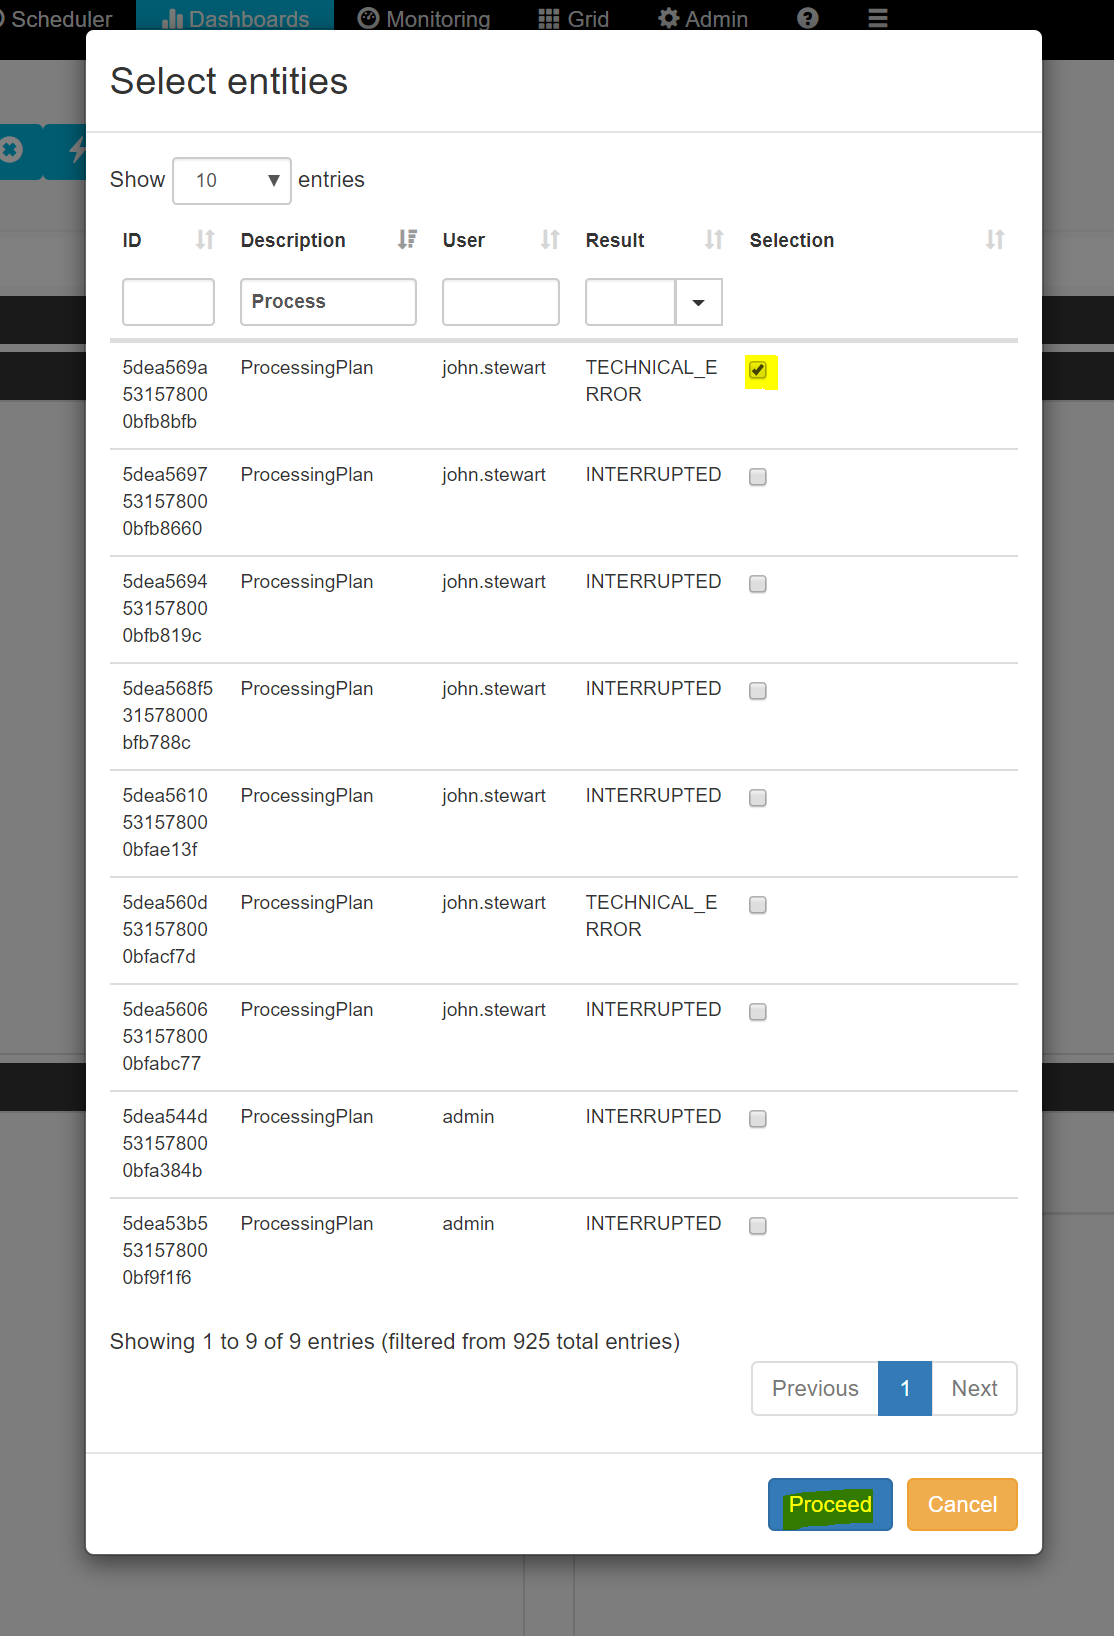
Select and apply a specific execution:
And the dashboard will update with the corresponding data:
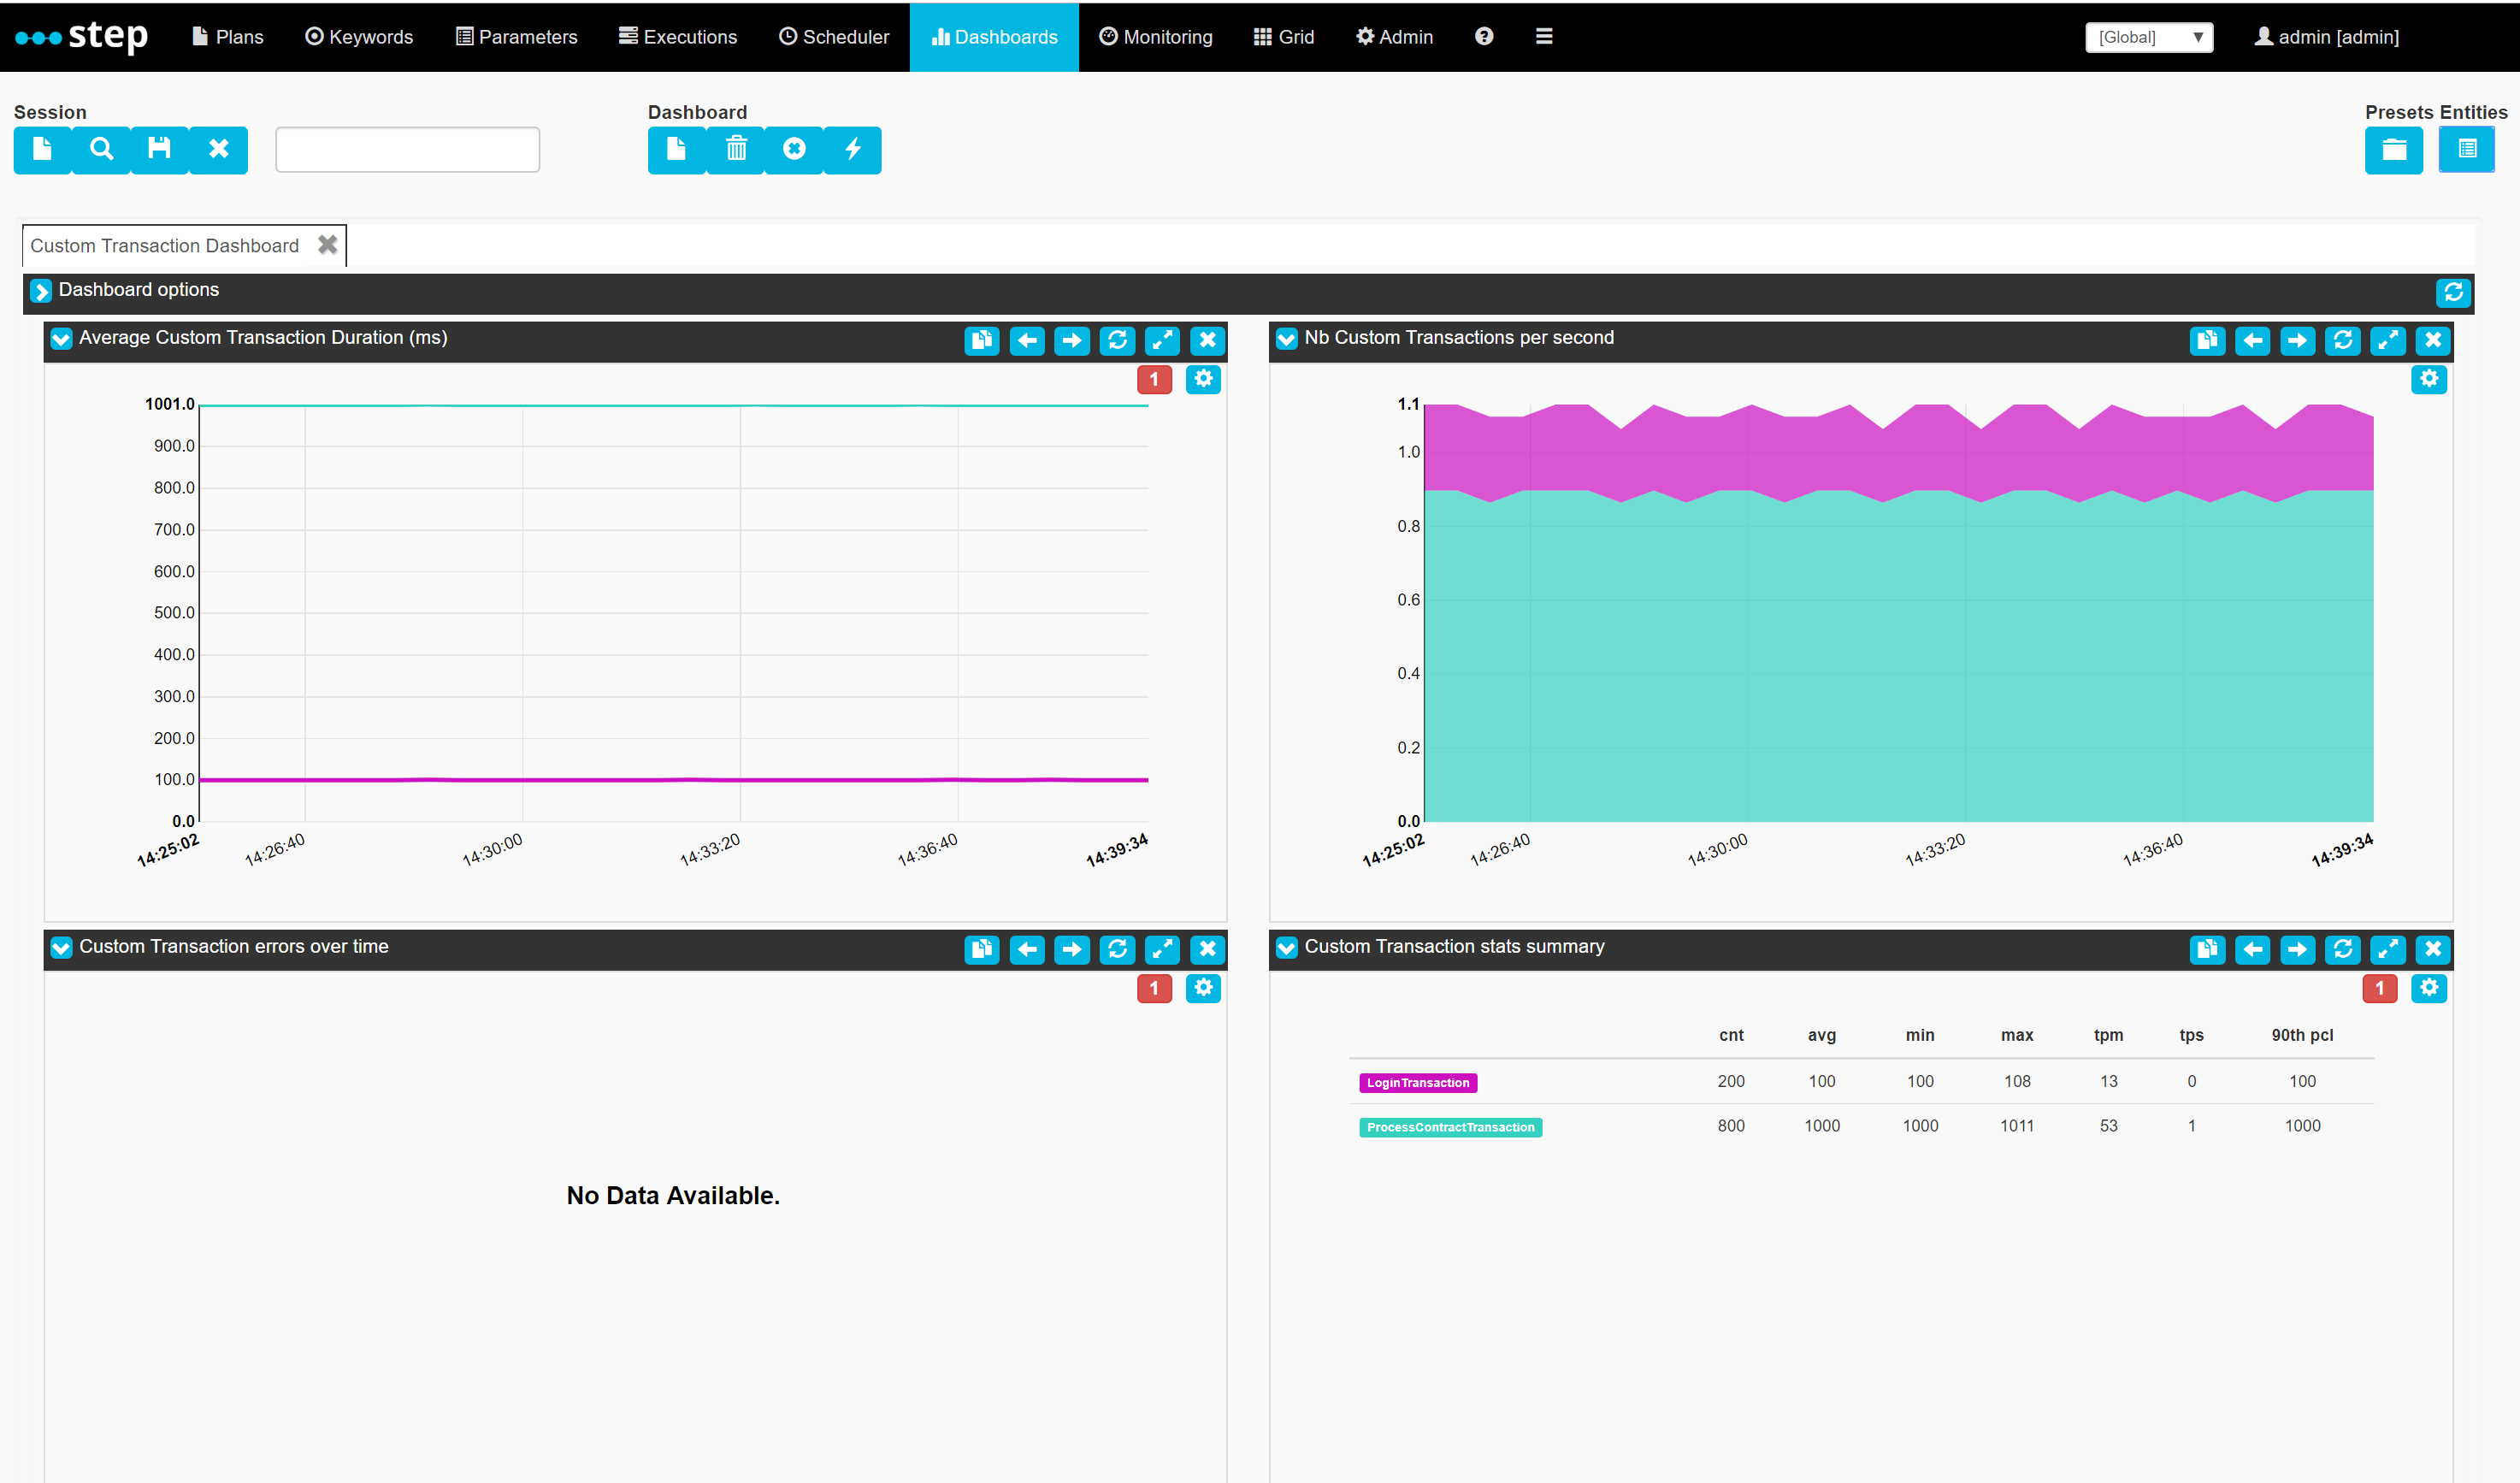
The same goes with the ProjectOverview preset, which requires the selection of a project entity.
Real-time incremental dashboards
Certain dashboards will temporarily save the data in your browser to allow you to record the state of counters over time. For example, the Enterprise Edition preset “RealtimeSelfMonitoring” records the state of step’s agent grid (or more specifically, the number of free tokens on each agent) as well as the number of on-going executions.
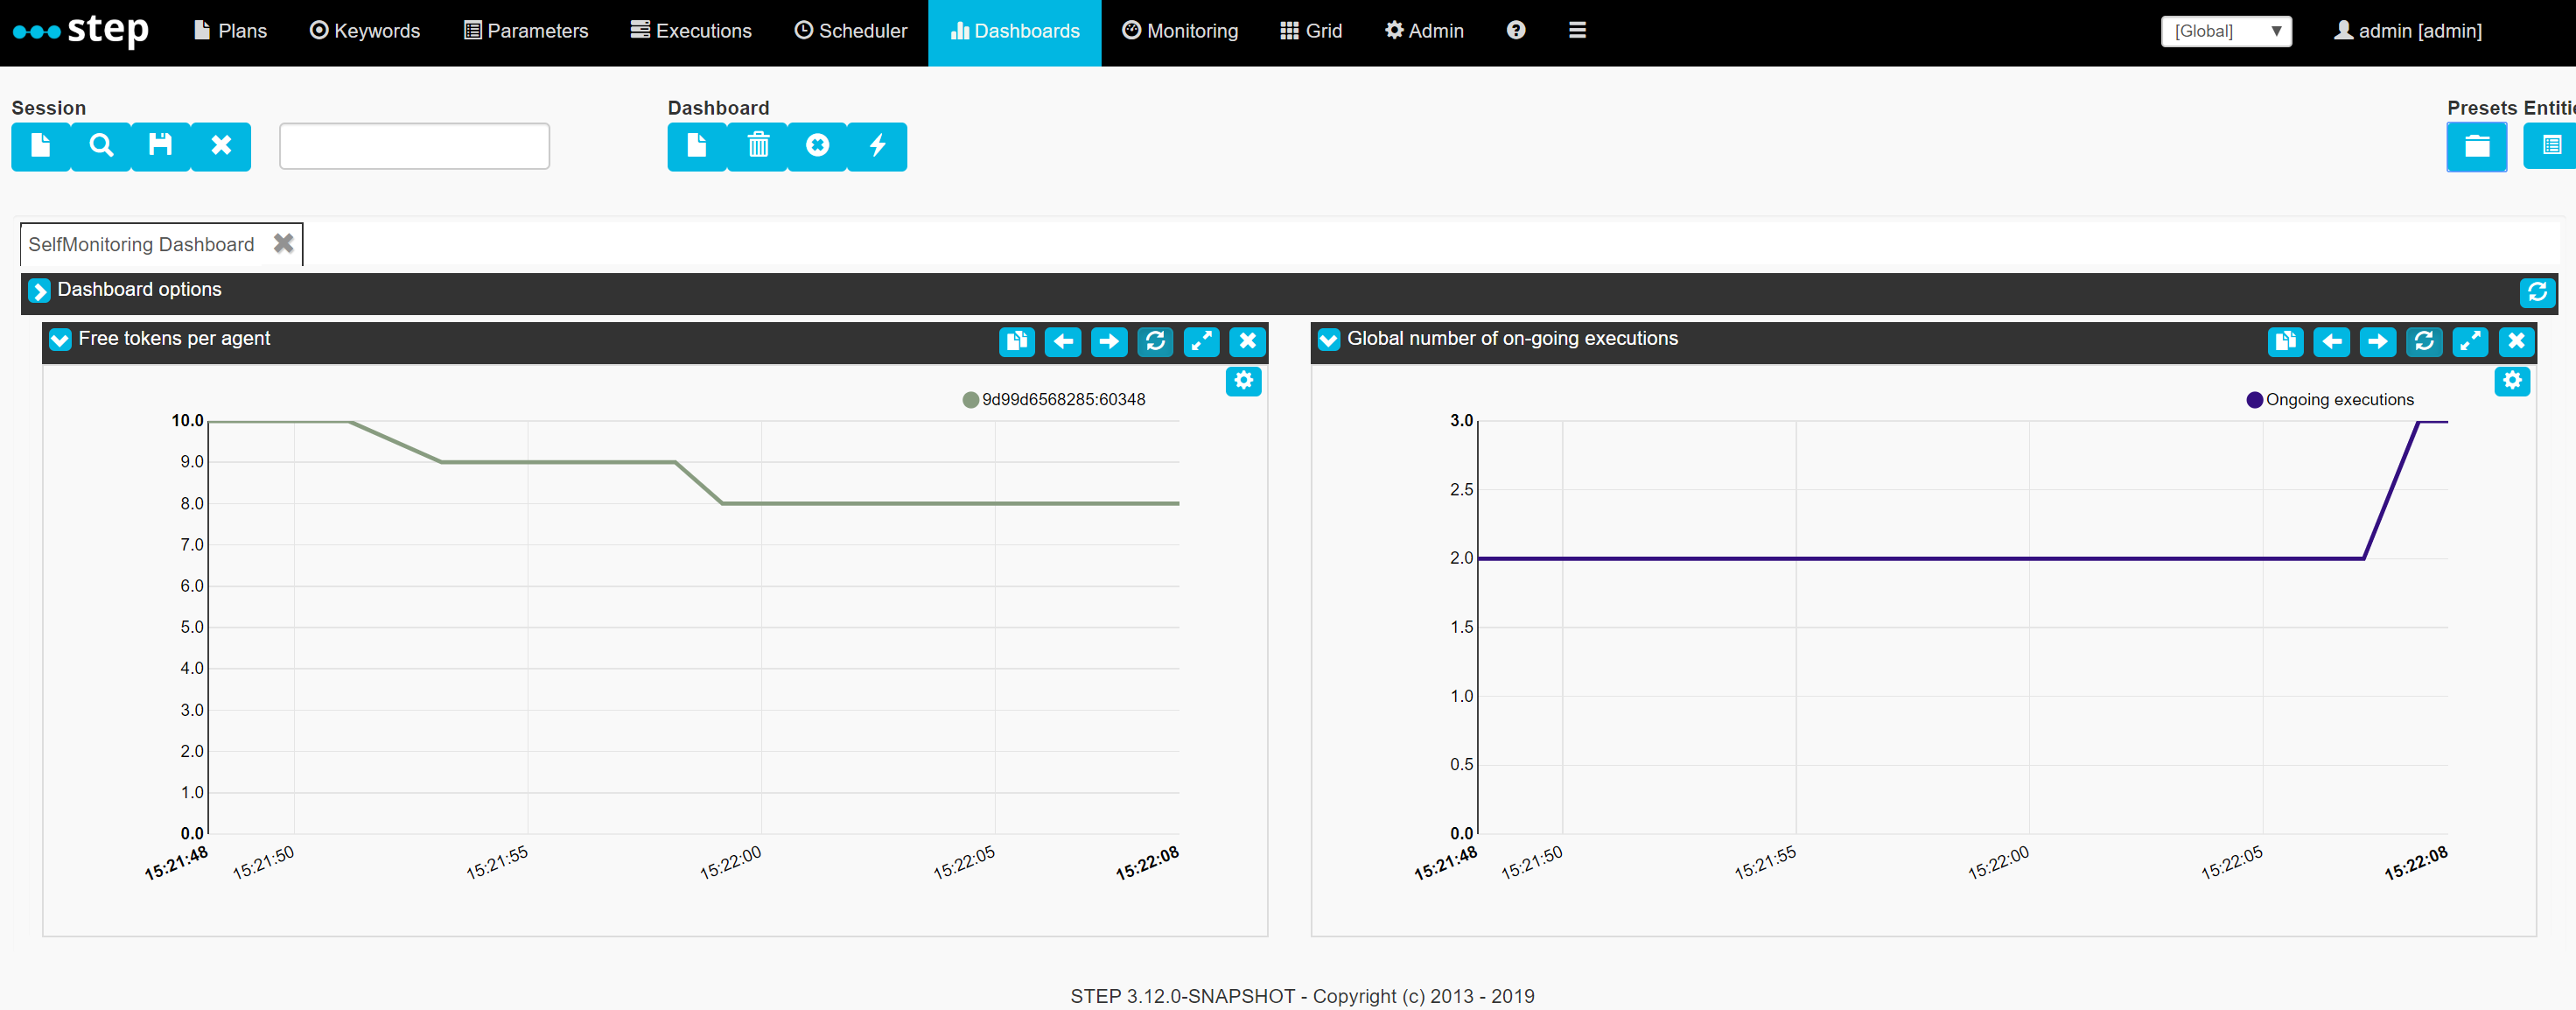
Users can load this preset whenever they want and then decide to persist the recorded data. We believe this to be a nice complementary feature for “on-the-go” monitoring. In order to build a more comprehensive history without relying on active monitoring, we recommend implementing and scheduling [monitoring plans]({{ < ref “Set_up_system_monitoring_with_step.md” > }}). The result of monitoring plans can then just as easily be loaded into a dashboard and the historical data can be aggregated using RTM’s services.
Creating a custom dashboard
Custom dashboards can be created using the dashboard tool box.
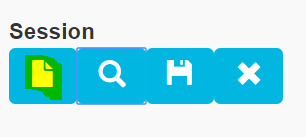
First, let’s create a new session by clicking the white page button of the Session tool box:
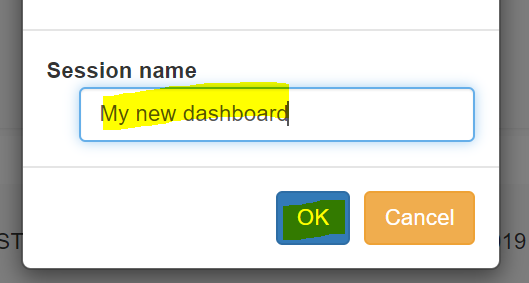
Then enter a name for our new session:
Unfold the Dashboard settings to give the new visualization tab a name as well:
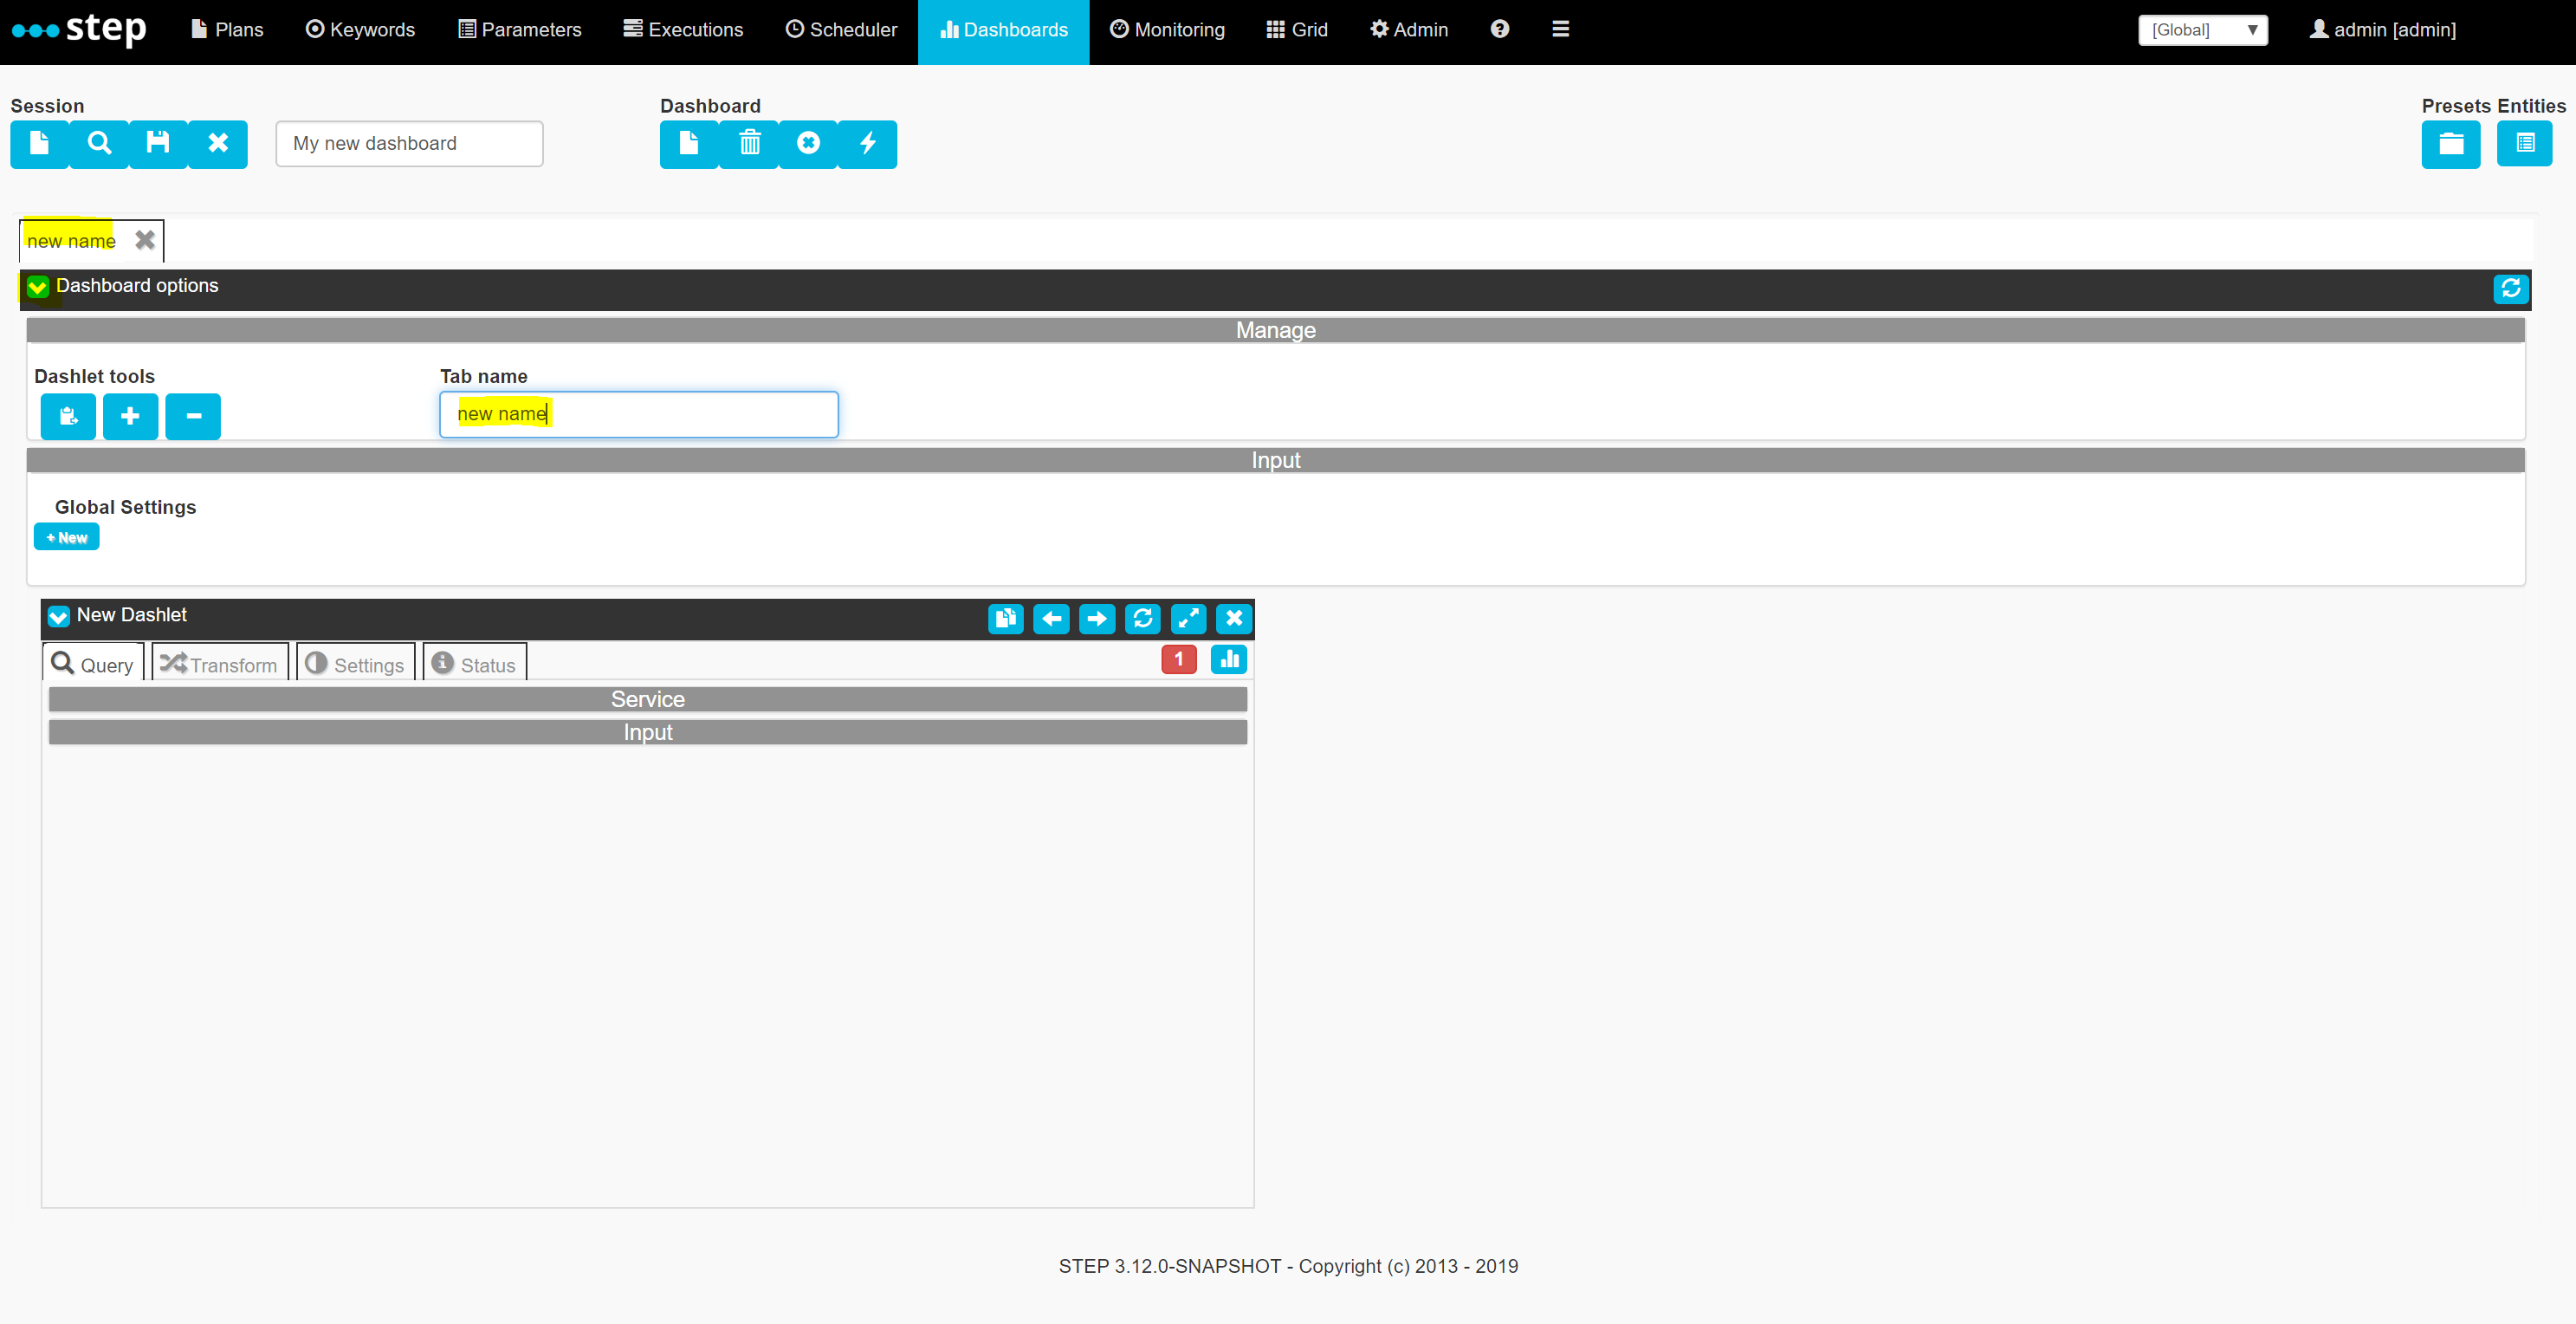
Then for the sake of this example we will set the service URL to one of wikimedia’s public REST services providing page view statistics. Use the following url:
https://wikimedia.org/api/rest_v1/metrics/pageviews/per-article/en.wikipedia/all-access/all-agents/Foo/daily/20151010/20151030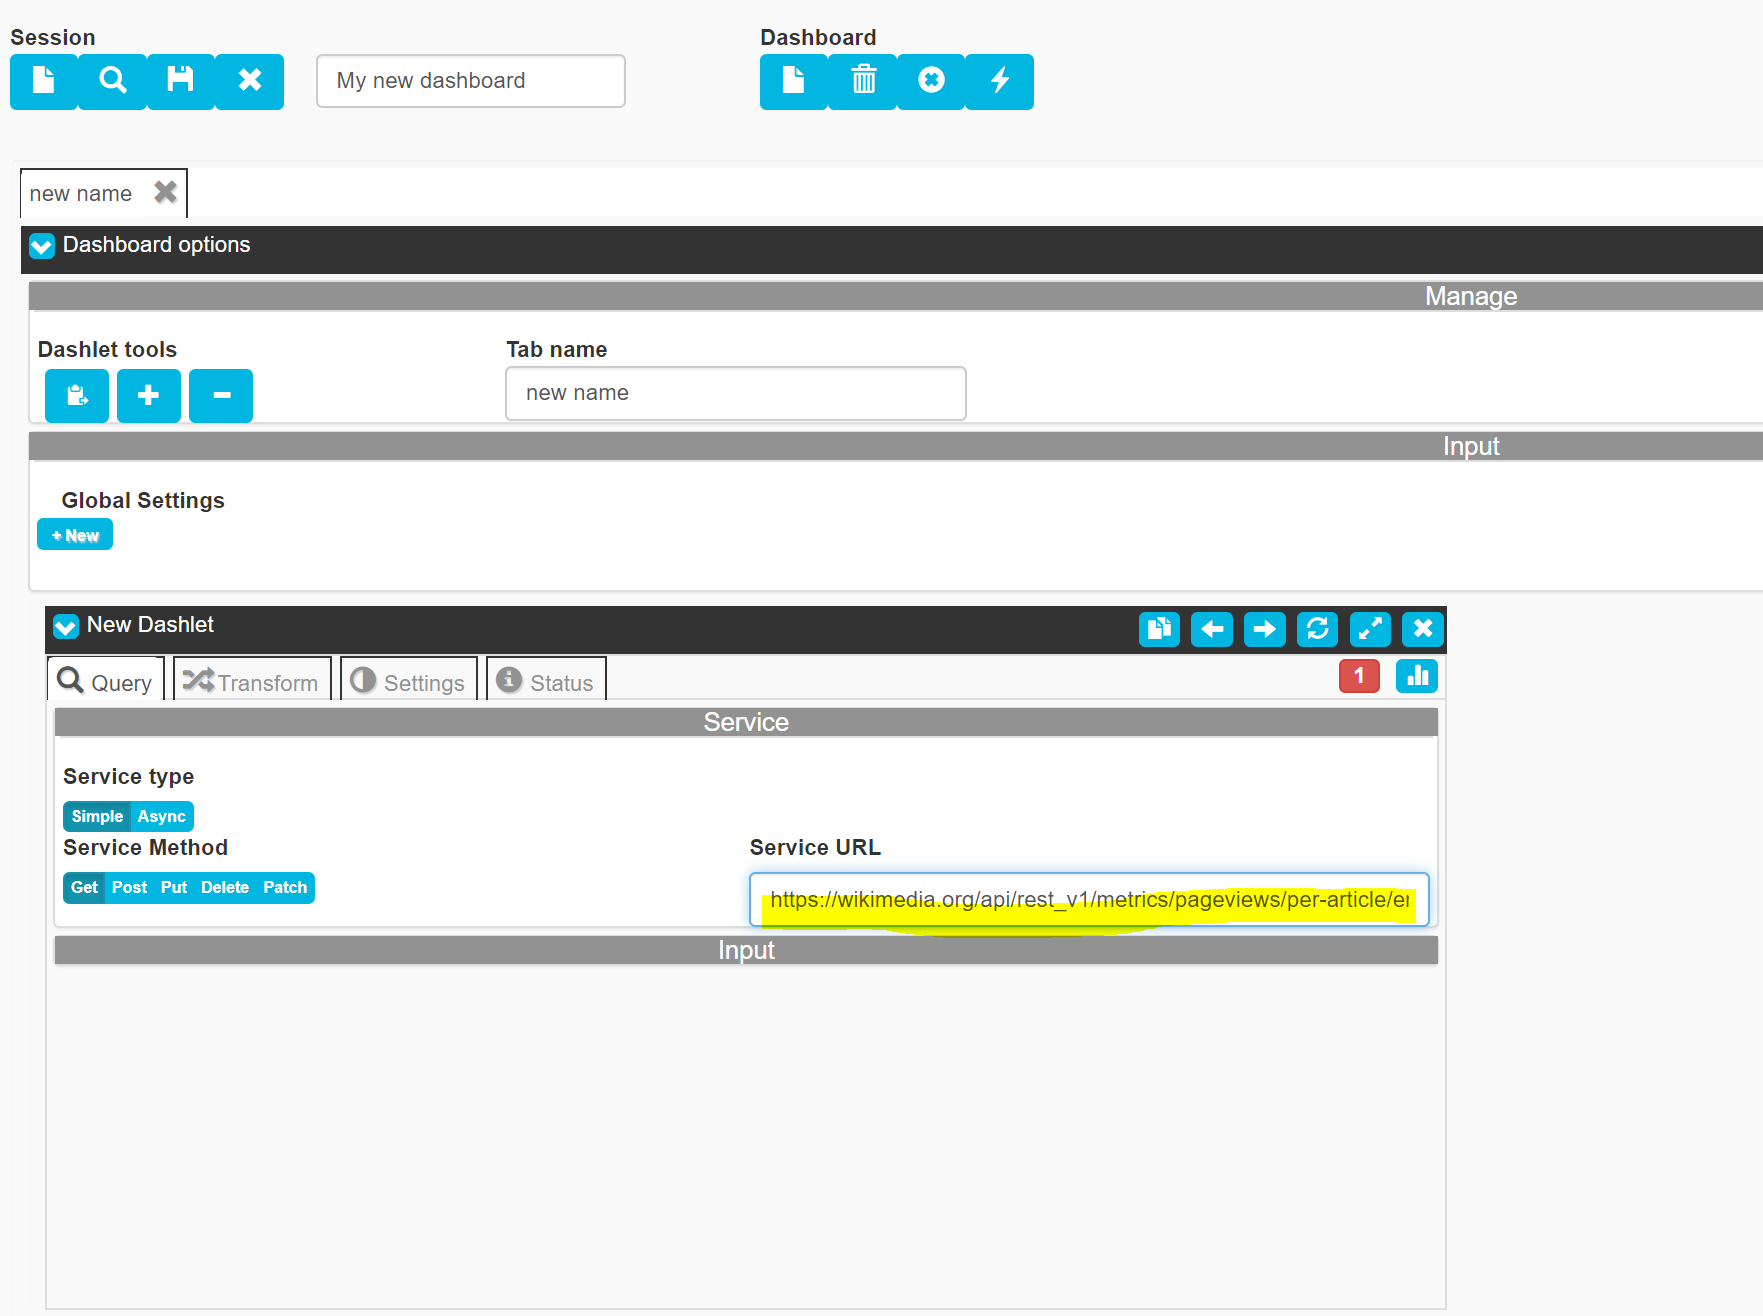
then go to the Transform tab of the dashlet:
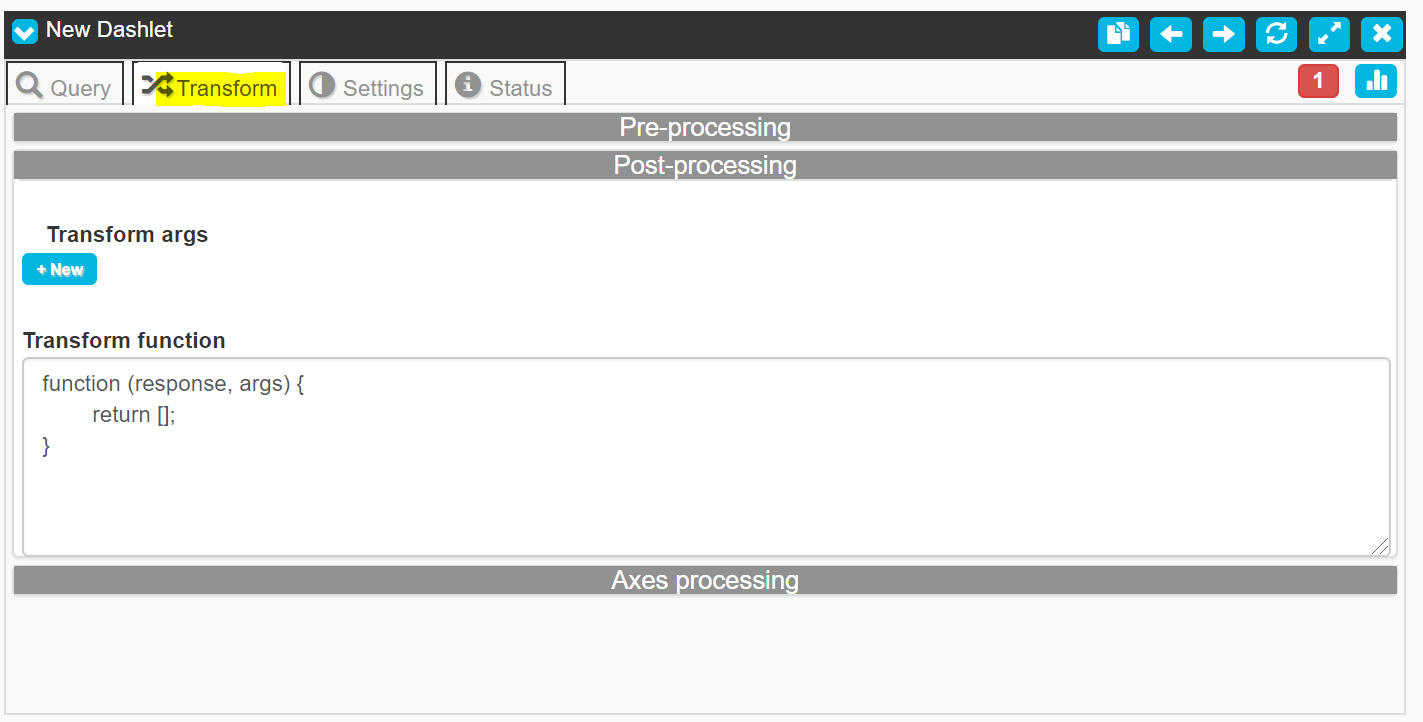
Copy paste the following transformation function into the Post-processing function box:
function (response, args) {
		var ret = [];
		var items = response.data.items;
		for(var i=0; i < items.length; i++){
			ret.push({x: items[i].timestamp, y: items[i].views, z: 'views'});
		}
		return ret;
	}
And click the visualization icon in the top right corner:
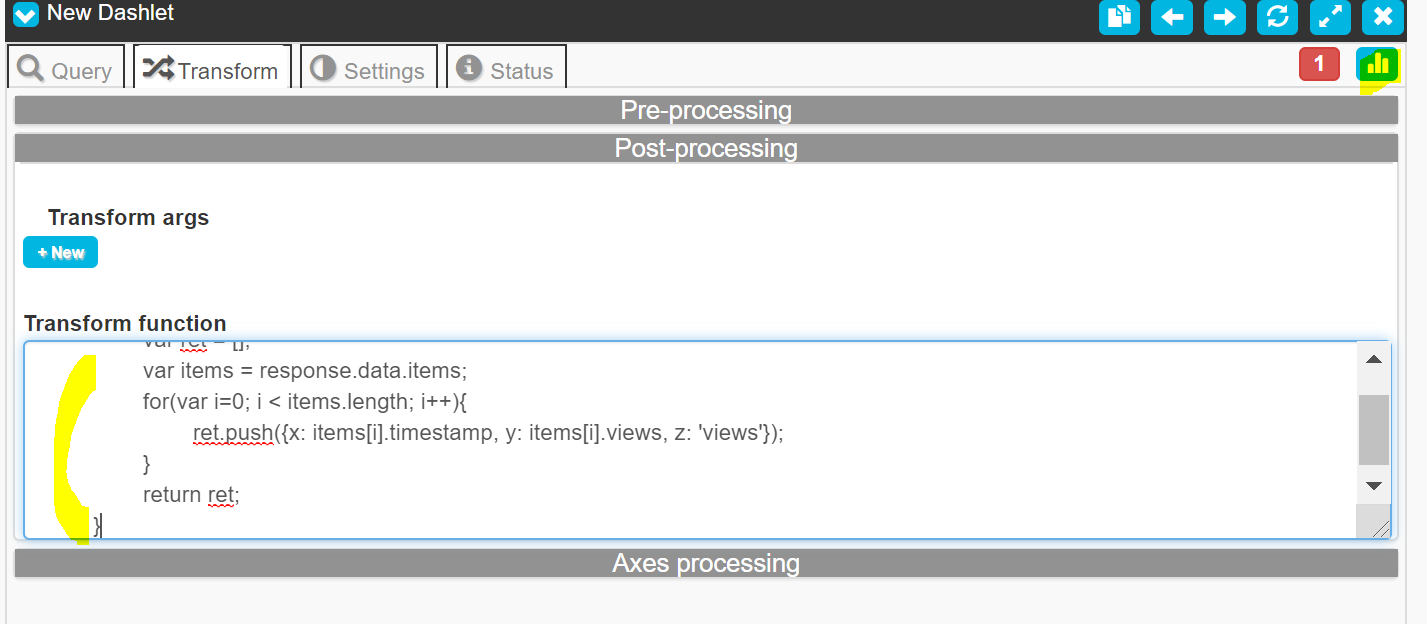
If your controller can connect to the internet, you should see the following result on screen:
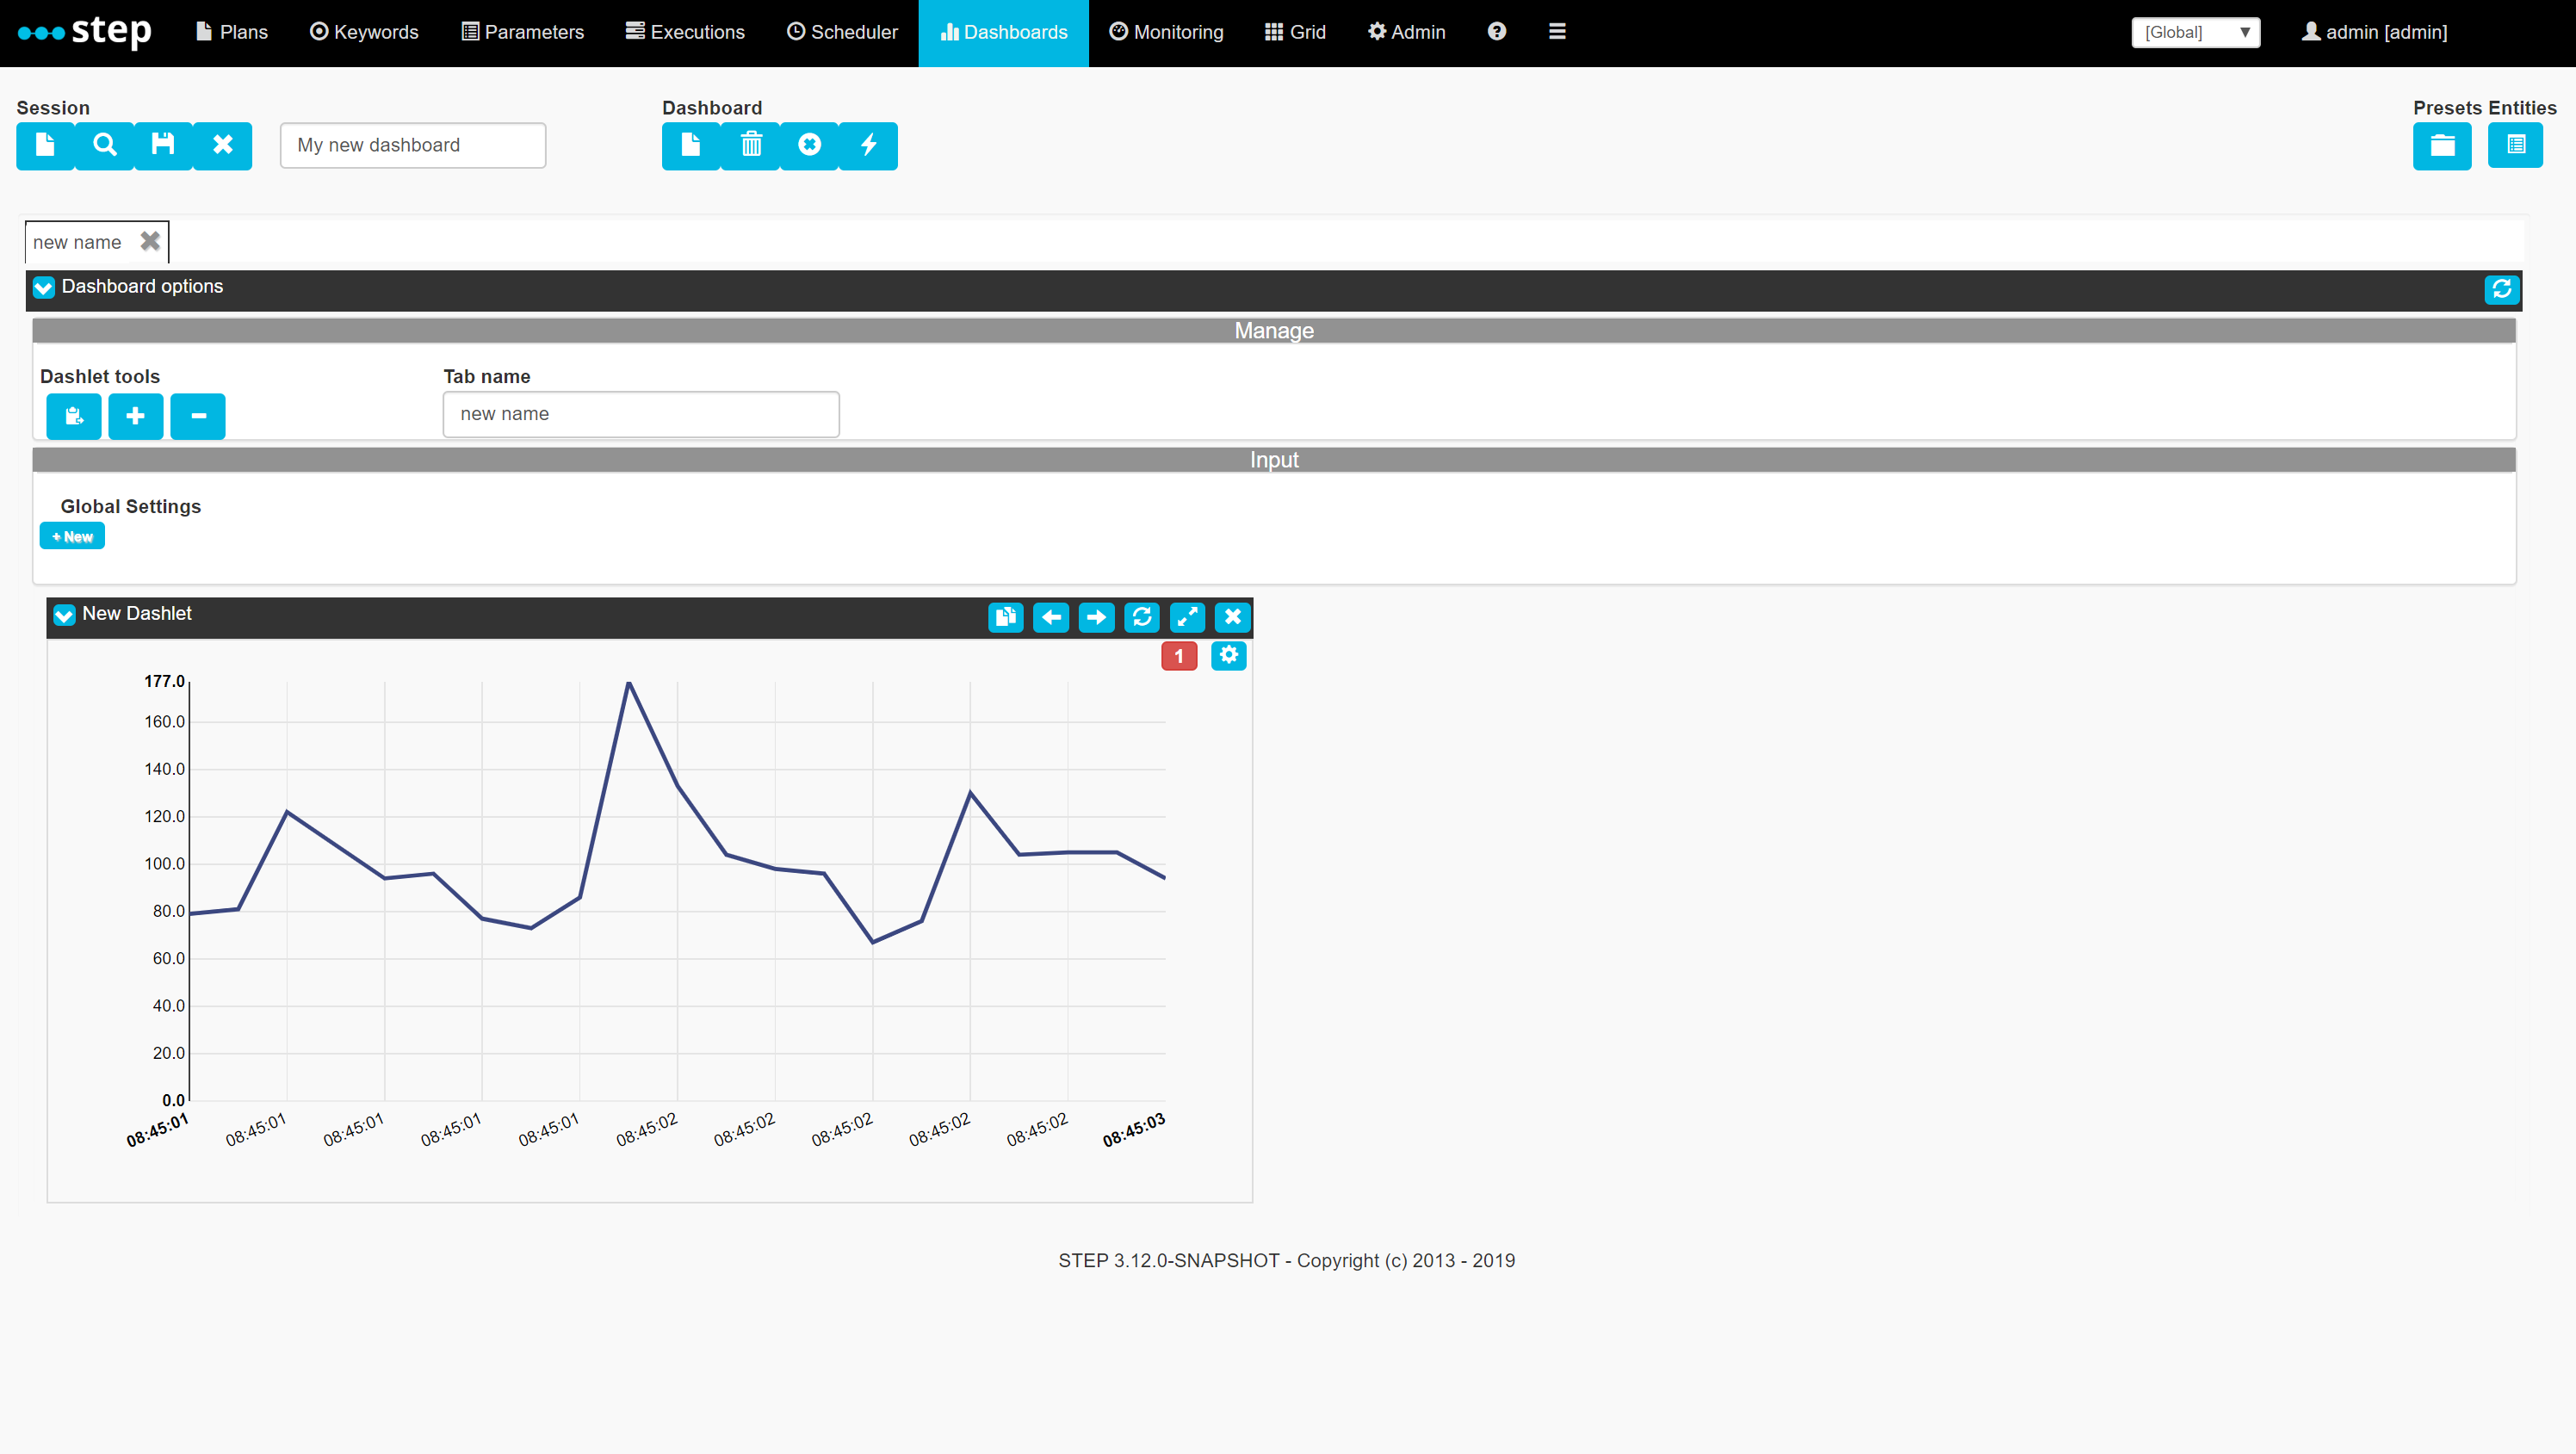
Congratulations, you’ve recreated your first dashboard! A version with templated from-to dates of this dashboard is provided as an example in the form of the “WikimediaDemo” preset.
More information on how to use the viz framework to create custom dashboards is provided on the project’s page.
Modifying presets
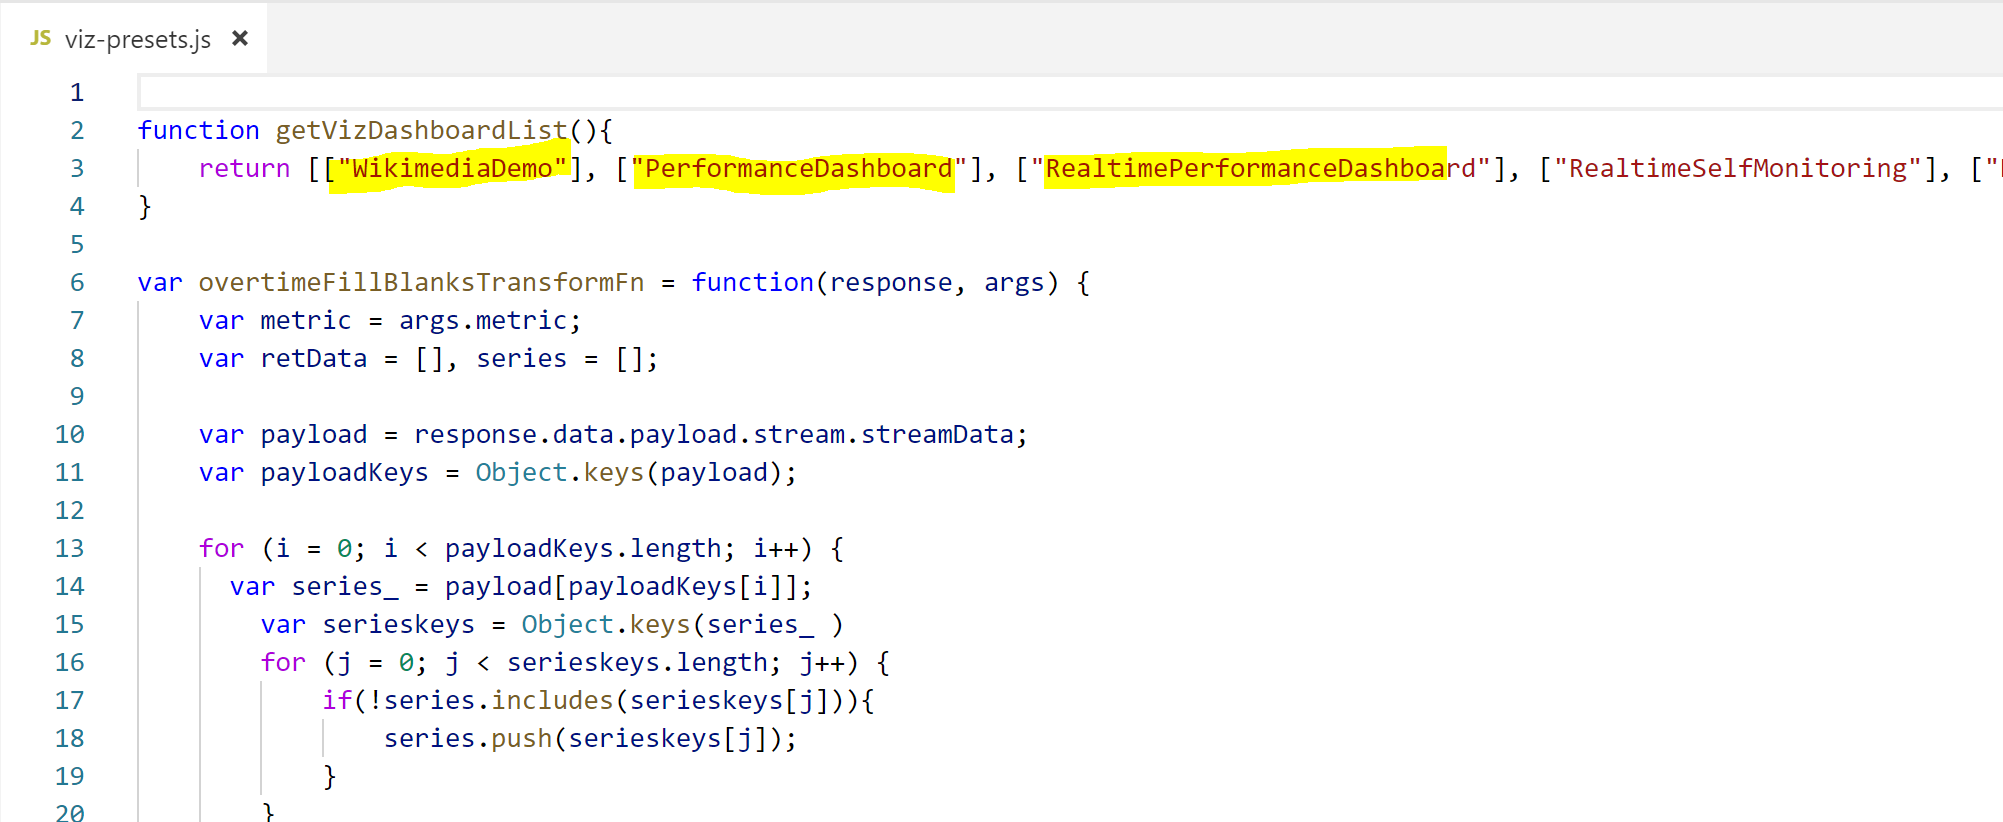
Enterprise customers can use viz’s programmatic API in order to develop presets which can then be added to the preset file “viz-presets” located in the conf/cosmetics folder od the controller.
The list of presets can also be tweaked depending on which dashboard(s) you want to be made available to your step users:
Data connectors
Although dashboards are primarily designed to fetch data over http, custom connectors can be deployed by adding new java services to the visualization framework. Below is the list of currently supported connectors and of connectors to come:
Supported synchronous connectors
- HTTP/HTTPS to both local and foreign sources
- Mongo Find Queries to both local and foreign databases
Supported asynchronous connectors
- HTTP/HTTPS to both local and foreign sources (for instance, RTM aggregation)
Upcoming connectors
In the same way presets will be added in future releases, here are a few ideas for connectors which may come in future releases, depending on popular needs and community feedback:
- Synchronous connectors: JDBC, JMX to foreign sources
- Asynchronous connectors: Managed Process, Plan runner
Custom controls
Controls enhance the way users configure the input of their dashlets. Currently, all dashboards make heavy use of Plain placeholder-style templating along with the interpretation of dynamic javascript expressions. However, new controls making the use of specific types of backends easier might be added in the future.