Live Reporting
Live Reporting allows to obtain keyword data such as measurements or attachments (for instance log files) in real time, while a keyword is running. This feature is being introduced as a Beta feature in Step 29 for K6 and custom Java keywords, and will see further improvements in upcoming Step versions.
Overview
Traditionally, all keyword results, such as attachments or measurements, are gathered while a keyword is running, then returned once the execution is finished. This approach is simple and proven, but it exposes a few important limitations:
- For long-running keyword invocations the results are only available after the execution is finished. While the keyword is running, it is essentially a black box from the user perspective, i.e., it is unclear how far it has progressed or what kind of data it is producing. Users always need to wait until the end of the invocation to see the results.
- Output size is limited. Because all data is returned at once, in a single message, at the end of the keyword execution, there are technical limitations on the message size that can be processed. While the default size of around 50 MB can be increased, handling very large responses remains challenging and may lead to stability issues due to increased memory requirements.
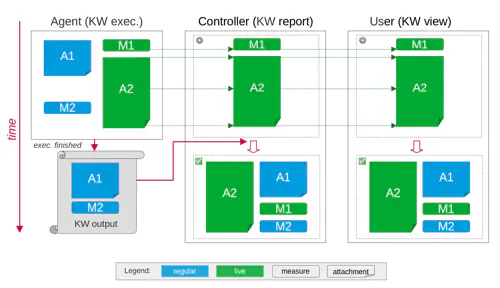
To address these issues, Step 29 introduces an alternative way to report results, named Live Reporting. It is a way to get results at the moment they are produced, without having to wait for the keyword execution to finish. Another established name for this kind of behavior, in particular for files, is “Streaming”. In the following, we use both terms interchangeably. We’ll refer to the existing and established way of returning results (attachments / measurements) at the end of the execution using the term regular or traditional, to distinguish the behavior from the live/streaming one.
The figure below shows the differences in behavior in a simplified diagram:
Here’s a concrete example of Live Reporting in action, executing a Keyword that uses the Grafana K6 plugin:
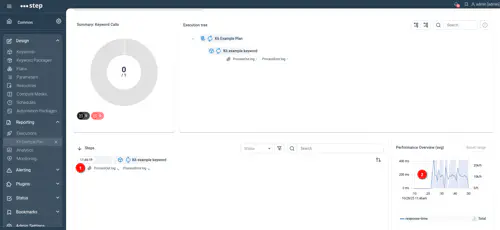
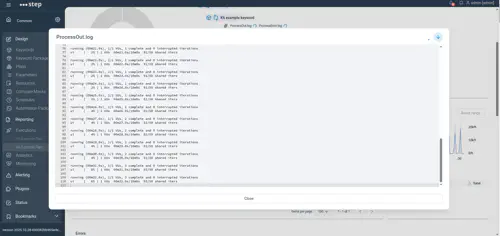
As you can see, attachments are already visible while being produced (1), and measurements are also available in real time (2). By clicking on such a live attachment, you can follow its content, receiving new updates as they happen:
The following sections go into more detail about individual aspects of this feature, including technical details and configuration requirements.
General configuration
The Websocket protocol, used for sending attachment data in realtime (see below for more details), allows for bidirectional communication over a “normal” HTTP(S) connection. Therefore, clients (such as the users accessing the Step web application with a browser) can directly establish a websocket connection with the controller in exactly the same fashion as they do for regular interactions.
The same applies to the Step agents - they will use the same kind of connection for transmitting websocket data. However, the agents forming the grid in addition have a separate communication method for low-level grid-related messages. In practice, what this means is:
- For Step grid-level communication with the controller, agents use the established grid protocol which is using a separate internal port. This communication mechanism has always been used between the Step agents and controller.
- For Live Reporting (both streaming attachments, and live measurements), agents use the same mechanism and port to connect to the controller as end users do. This communication mechanism between agents and controller is newly introduced to support the Live Reporting requirements.
In order to achieve a seamless communication, the following configuration is required.
Controller configuration
The step.properties file contains the global system configuration for the Step controller.
In this file, the following setting must be defined, indicating the public base URL where the controller is reachable:
controller.url=https://step.example.com/
Optional agent-side overriding configuration
In most situations, specifying the controller.url in the controller configuration, as explained just above, should be sufficient for the agents to correctly establish live reporting connections to the controller.
In case your Step cluster has a special topology where this is not the case (for instance if the public-facing domain name can not be resolved from the agent hosts, or you have deviating routing requirements, etc.), you can override this setting on a per-agent basis in the agent’s configuration file. The effect is that the respective agent will use the configured base URL instead of the controller-supplied one:
Example AgentConf.yaml snippet:
properties:
  step.reporting.url: "https://step-controller.lan:443"
Example AgentConf.json snippet (legacy configuration format):
{
  "properties": {
    "step.reporting.url": "https://step-controller.lan:443"
  }
}
File streaming
Real-time file/attachments streaming is made possible by leveraging WebSockets under the hood. This standardized and widely employed protocol allows for immediate transmission of data between agent, controller, and the user’s browser. In a nutshell:
- The agent monitors files (for instance log files) as they are being written, and immediately pushes data to the controller when it becomes available.
- The controller, upon reception of new data, updates the attachment state (content and metadata such as the size).
- All clients interested in the respective attachment – such as the user’s browser – receive an event informing them that the metadata has changed, and can directly request newly available data so it can be displayed in real time.
Streamed attachment quota configuration
In contrast to the size limit for traditional attachments (which is due to these attachments all being sent in a single HTTP message), there is technically no limit for live attachment sizes. However, to avoid filling up the controller storage in an uncontrolled manner, there are still quotas in place by default. These quotas can be changed or disabled using the Step configuration.
For technical reasons, streamed attachments are internally handled separately from “regular” attachments. This also means that their quotas are managed independently. The following section therefore only applies to streamed attachments, it does not impact non-streamed attachments, which are subject to the existing and separate quota enforcement.
You can limit
- the number of streamed attachments per execution (default: unlimited)
- the total size of streamed attachments per execution (default: 500 MB)
- the size of each individual streamed attachment (default: unlimited)
Notes
Total file size limit per execution
By default, only the total file size per execution (i.e., the total number of bytes for all streamed attachments produced by an execution) is limited. The default is 500,000,000 bytes, i.e., roughly 500 MB. This corresponds to the following definition in step.properties:
reporting.attachments.streaming.quota.maxBytesPerExecution = 500000000
Total file count limit per execution
If you wish to limit the number of streamed attachments per execution, add the respective setting to step.properties. The default is unlimited, which corresponds to this configuration entry:
reporting.attachments.streaming.quota.maxResourcesPerExecution = -1
Individual file size limit
If you wish to enforce limits on the size of each individual streamed attachment, set the maximum allowed file size (in bytes) in step.properties. The default is unlimited, which corresponds to this configuration entry:
reporting.attachments.streaming.quota.maxBytesPerResource = -1
Overriding limits at runtime
The limits defined in step.properties define the default quota values as explained above. If required, the quota values may be adjusted at runtime during a plan execution, for instance to lower or raise (or completely disable) quotas for an individual execution.
If you wish to allow runtime redefinition of quota values, define and set the following value to true in step.properties (shown below is the implicit default configuration, which does not allow runtime overrides):
reporting.attachments.streaming.quota.runtimeOverridable = false
Considerations and advanced configuration
While streaming attachments in real time is a very useful feature, please keep in mind that it places an additional burden on many parts of the infrastructure:
- It requires additional processing power, i.e., parallel threads, on the producing side.
- Each concurrent upload requires a persistent socket connection from the agent to the controller during its lifetime.
- Depending on the volume of data and the rate at which it is produced, network or processing congestion (especially on the receiving controller side) could become an issue.
Agent-side configuration
Because live file streaming happens in parallel to the actual keyword execution, it necessarily requires additional threads on the producer side. For each concurrent upload, an additional thread is required and in use for the complete duration of the upload – i.e., from the moment where a live upload is initiated and the monitoring of the file starts, until the transmission is completed (or aborted).
Each agent instantiates a thread pool for this purpose (threads are created and released on demand). The pool’s sizing is configurable using the following properties in the agent configuration, shown with the default values:
  step.reporting.livereporting.poolsize: 100
  step.reporting.livereporting.queuesize: 1000
The pool size determines the maximum number of concurrent uploads (total, across all keyword executions on the agent); once the pool is exhausted, i.e., when all threads are active, additional requests are queued up to the configured queue size, and processed as threads in the pool become available. If the queue is also full, further requests will be rejected, resulting in runtime exceptions.
Live measurements
Live measurements are simpler to handle than streaming uploads, because they do not change over time, but are finalized and sent exactly once. They function exactly like the “regular” measurements in that they allow to measure and report arbitrary timing data, with two small differences:
- Live measurements are reported in real time (with a potential minimal delay due to batching multiple consecutive measurements for efficiency), whereas regular measurements are only reported after the keyword execution.
- Regular measurements, by default, report the status of the keyword call that produced them. This is possible because they are transmitted after the keyword execution is finished, so that status is known at processing time. Live measurements cannot contain the final status of the keyword call, as they are produced before it is known, so implementations must directly set a status on the measurement at the time it is finalized.