Scheduled execution reporting
In this view, you can find reports aggregated across multiple executions of the same schedule. The main purpose of this view is to provide insights into whether scheduled executions have passed or failed over time.
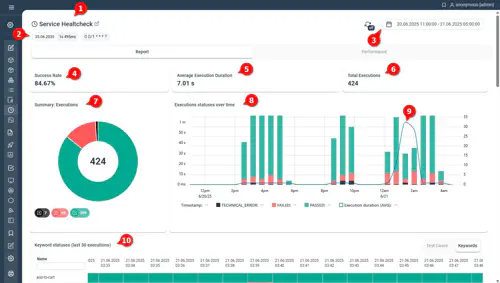
- Schedule Name – The name of the scheduled task. Use quick-actions to configure the associated plan or schedule.
- Last Execution – The most recent time the schedule was executed and its result (pass/fail).
- The settings for automatic refresh and the time range to be shown. The time range can also be altered by dragging the mouse over a chart. (default: one week)
- Overall success rate – The percentage of the successful executions across the selected time window
- Average Duration – The average duration across all executions within the selected time window.
- Total Executions – The total number of executions in the selected time window.
- Execution Summary – A summary of all executions within the selected time range.
- Execution Status Over Time – Displays the status of each execution over time. Depending on execution frequency and selected time range, multiple executions may appear in a single column.
- Execution duration – The line showing average execution duration.
- Statusses over time
Statuses History (HeatMap)
This Panel displays either the Test Case statuses or Keyword statuses for the last 30 executions as a heatmap. This feature works similar to the Execution History feature.
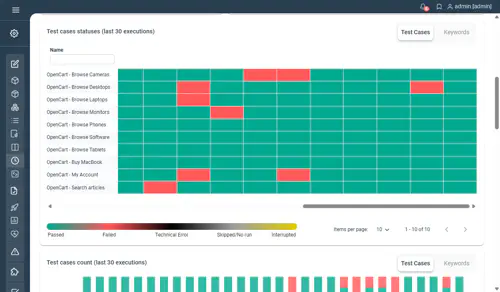
In case each Test Case or Keyword has only one status (because it was only executed once) its table-cell clearly shows that status colour. However, as Test Cases or Keywords can be executed multiple times (i.e. if they are in a for-loop) multiple different results are possible, in these cases we are showing a mix of the colours. Some of the possible colour-combinations are displayed in the legend.
Synthetic Monitoring
For synthetic monitoring, this view is particularly useful to:
-
Proactively Detect Issues - Identify failures before real users experience them.
Spot patterns of degradation or performance issues over time. -
Analyze Trends - Track success, failure, and warning rates across different periods.
Identify recurring failures at specific times or under specific conditions.
Functional tests
For recurring functional tests, this view can be particularly useful to determine:
- When a specific error pattern first occurred.
- Whether there is a positive trend in resolving failed test cases over time.