Schedule executions reporting
In this view, you can find reports aggregated across multiple executions of the same schedule. The main purpose of this view is to provide insights into whether scheduled executions have passed or failed over time.
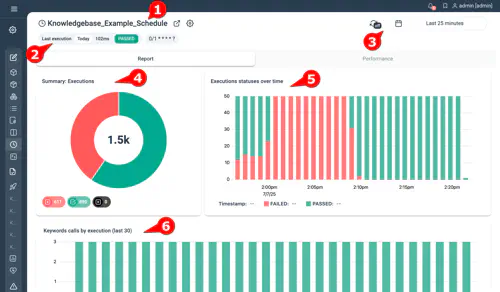
- Schedule Name – The name of the scheduled task. Use quick-actions to configure the associated plan or schedule.
- Last Execution – The most recent time the schedule was executed and its result (pass/fail).
- The settings for automatic refresh and the time range to be shown. The time range can also be altered by dragging the mouse over a chart. (default: one week)
- Execution Summary – A summary of all executions within the selected time range.
- Execution Status Over Time – Displays the status of each execution over time. Depending on execution frequency and selected time range, multiple executions may appear in a single column.
- Keyword Calls per Execution – Shows keyword call statuses for the last 30 executions within the selected time range. This helps to identify trends or shifts in the distribution of keyword statuses.
- Testcases Calls per Execution – Shows testcase call statuses for the last 30 executions within the selected time range for plans containing testcases. This helps to identify trends or shifts in the distribution of keyword statuses. (Not visible on screenshot)
Synthetic Monitoring
For synthetic monitoring, this view is particularly useful to:
-
Proactively Detect Issues - Identify failures before real users experience them.
Spot patterns of degradation or performance issues over time. -
Analyze Trends - Track success, failure, and warning rates across different periods.
Identify recurring failures at specific times or under specific conditions.
Functional tests
For recurring functional tests, this view can be particularly useful to determine:
- When a specific error pattern first occurred.
- Whether there is a positive trend in resolving failed test cases over time.