• Documentation
  • Tutorials
  • Case studies
  • Blogs
  • Product

What's on this Page

  • step
  • User guide
  • Event Broker Monitor
Categories: USER GUIDE EVENT BROKER ENTERPRISE
This article references one of our previous releases, click here to go to our latest version instead.

Event Broker Monitor

If you’ve purchased the Async package or are running the Premium Enterprise version of Step, you’ll be able to monitor in real time what’s happening in the EventBroker by navigating to the EventBrokerMonitor view:

Screenshot of the EventBrokerMonitor

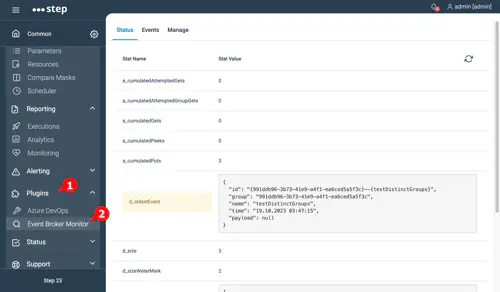
The Stats tab provides global statistics on the broker, such as the current amount of messages present in it and the high mark (or water mark), oldest & youngest events, etc.

The next two tabs provide users with the ability to browse and search for events, and organizes the query results either by Id or Group.

The last tab allows for easy testing as well as configuring the broker.

See Also

  • Controls
  • Automation Package descriptor
  • Automation Packages
  • Event Broker API
  • Maven plugin
  • Home
  • Whats new?
  • Admin guide
  • SaaS guide
  • User guide
    • Keywords
    • Plans
    • Executions
    • Alerting rules
    • Incidents
    • Notifications
    • Parameters
    • Analytics
    • Analytics (beta)
    • Monitoring
    • Schedules
    • Event Broker Monitor
    • Import/Export entities
    • User account
    • Versioning
  • Developer guide
  • DevOps
  • Plugins
  • Libraries
Step Logo
    • Documentation
    • Tutorials
    • Case studies
    • Blogs
    • Product
    • Home
    • Whats new?
    • Admin guide
    • SaaS guide
    • User guide
      • Keywords
      • Plans
      • Executions
      • Alerting rules
      • Incidents
      • Notifications
      • Parameters
      • Analytics
      • Analytics (beta)
      • Monitoring
      • Schedules
      • Event Broker Monitor
      • Import/Export entities
      • User account
      • Versioning
    • Developer guide
    • DevOps
    • Plugins
    • Libraries