Analytics and external DBs
Introduction
If you want to perform analytics or create dashboards on data generated by Step using a 3rd party product (such as Grafana or Splunk), the following enterprise plugins of Step enable writing such data to external databases.
- JDBC (SQL)
- Prometheus
- Logback
You may also directly query measurement data stored in the Step database and used by the Step analytics views; they are located in the following 2 tables (aka collection for mongodb):
- timeseries: contains the measurements collected as time series
- measurements: contains the RAW measurements
In all cases, the Step user is responsible for setting up and maintaining the external database of choice. Below we provide details on required configuration on the Step side.
Installation and usage
Plugins can be enabled by uncommenting relevant lines in step.properties of Step Controller (CONTROLLER_DIR\conf\step.properties).
plugins.JdbcControllerPlugin.enabled=false
plugins.PrometheusControllerPlugin.enabled=true
plugins.LogMeasurementControllerPlugin.enabled=false
JDBC (SQL)
With the JDBC plugin Step may write data in SQL-based databases, such as PostgreSQL or MySQL.
A note on exporting noSQL-like data into SQL databases. Since the keywords used in Step can be highly customized, each measurement generated by Step contains a set of required fields (in bold) and may contain arbitrary amount of extra fields:
{
  begin: ... ,
  eId: ... ,
  name: ... ,
  planId: ... ,
  rnStatus: ... ,
  taskId: ... ,
  type: ... ,
  value: ... ,
  customField1: ... ,
  customField2: ... ,
  customField3: ... ,
  customField4: ... ,
  ...
}
Since SQL databases are not designed for dynamic schema adjustments, the JDBC plugin deals with this by exposing the required fields as separate columns and additionally exposing the custom fields as a json and writing them into a json-type column. PostgreSQL and MySQL support json as valid types, but other SQL databases may not, therefore the option to expose json with the custom measurement data can be enabled or disabled separately.
The plugin has been tested with PostgreSQL 12 and MySQL 8.
Enabling the JDBC plugin
To use the plugin:
-
the user must add the JDBC driver library corresponding to its database to the
CONTROLLER_DIR\libfolder -
e.g. for PostgreSQL, download the relevant
.jartoCONTROLLER_DIR\libfolder -
enable the plugin in
step.propertiesby setting
plugins.JdbcControllerPlugin.enabled=true
- configure the database url, user and password in
step.properties, for example:
plugins.measurements.jdbc.url=jdbc:postgresql://localhost/step
plugins.measurements.jdbc.user=postgres
plugins.measurements.jdbc.password=test
Providing and configuration the database with proper indexing is the users’ responsibility, the table schema must be respected.
- optionally: enable writing of the custom fields in a json column:
plugins.measurements.jdbc.jsonColumn=true
PostgreSQL with TimescaleDB
For best performance, we recommend setting up PostgreSQL together with TimescaleDB. TimescaleDB is an open-source time-series database, available as an extension to PostgreSQL, and can be turned on and off on isolated tables in the database. TimescaleDB tables are called “hypertables”. Writing and reading data is done using normal SQL and in addition TimescaleDB provides extra functions facilitating working with time-series data. While it is not mandatory to have TimescaleDB installed in order to be able to ingest and use Step data, time-series data stored in a TimescaleDB hypertable can be processed many times faster as compared to a normal PostgreSQL table.
The community edition of TimescaleDB is available with 2 different open-source licenses, please consult the official documentation of TimescaleDB to pick the best one for your needs.
Installation of TimescaleDB (optional)
Install PostgreSQL and TimescaleDB following official instructions. We recommend to run the automatic tuning tool by TimescaleDB.
After the installation, TimescaleDB needs to be separately enabled in the database by running a CREATE EXTENSION command (see below).
Installation of t-digest (optional)
In order to be able to calculate percentiles quickly, we recommend using the t-digest algorithm. Its SQL implementation by Tomas Vondra is available as an open source extension to PostgreSQL.
To install t-digest extension on a Linux machine, simply clone the repository, go to the cloned directory, then run:
sudo apt-get install postgresql-server-dev-12
make
sudo make install
If you are using a different Postgres version than v12, adjust the first command accordingly.
To install t-digest extension on a Windows machine, the code needs to be first compiled to a dll library. Consult here and here for detailed instructions if you require to compile it yourself. Here for convenience we provide a pre-compiled dll for a 64-bit Windows 10 machine, although we cannot give 100% guarantee that it will work on your particular system. Once you have a compiled dll, in order to install the extension you have to manually:
- copy
tdigest.dlltoPOSTGRES_DIR\lib - copy
tdigest.control,tdigest--1.0.0.sql,tdigest--1.0.0--1.0.1.sqltoPOSTGRES_DIR\share\extension
On all systems, after the installation the extension needs to be separately enabled in the database by invoking CREATE EXTENSION command (see below).
Required schema
Create the database and enable extensions if needed:
CREATE database step;
\c step
CREATE EXTENSION IF NOT EXISTS timescaledb;
CREATE EXTENSION IF NOT EXISTS tdigest;
Create the table which will hold measurements generated by Step:
CREATE TABLE measurements (
	begin timestamptz NOT NULL,
	eId text,
	status text,
	planId text,
	taskId text,
	name text,
	type text,
	value integer,
	info jsonb
);
For TimescaleDB to be used, this table needs to be explicitly converted to a hypertable:
SELECT create_hypertable('measurements', 'begin');
Depending on type of queries that are being executed, the user is free to decide to set up additional indexes on this table.
MySQL
Create the database:
CREATE database step;
USE step;
Create the table which will hold measurements generated by Step:
CREATE TABLE measurements (
	begin timestamp NOT NULL,
	eId text,
	status text,
	planId text,
	taskId text,
	name text,
	type text,
	value integer,
	info json
);
CREATE INDEX begin on measurements (begin);
CREATE INDEX begin_eId on measurements (eId(24),begin);
Prometheus
Prometheus is a popular open-source monitoring system. Prometheus Step plugin exposes the generated data at an endpoint which is then scraped by Prometheus in regular time intervals. Both Step and Prometheus need to be configured for the data export to work (see below).
In addition to the response times metrics, the plugin exposes the controller JVM and jetty metrics for internal/technical monitoring too.
Installing and setting up Prometheus
Install Prometheus following the official instructions.
In order to configure Prometheus to scrape Step data, add the scraping job in prometheus.yml in the scrape_configs section:
scrape_configs:
  # The job name is added as a label `job=<job_name>` to any timeseries scraped from this config.
  - job_name: 'YOUR_STEP_JOB_NAME'

    # metrics_path defaults to '/metrics'
    # scheme defaults to 'http'.

    static_configs:
    - targets: ['CONTROLLER_URL']
Where CONTROLLER_URL is the URL where your Step controller is deployed, e.g. localhost:8080. The URL needs to be enclosed in single-quotes. The Step plugin exposes the data at the CONTROLLER_URL/metrics endpoint, so you don’t have to change metrics_path defaults.
By default, Prometheus scrapes the Step endpoint every 15s. This setting may be changed in the prometheus.yml file following the Prometheus documentation. The Step plugin is not affected by this setting.
Enabling the plugin
Enable the plugin in step.properties by setting
plugins.PrometheusControllerPlugin.enabled=true
To make Prometheus calculate percentiles, for each keyword a time-series of histograms is created. The histograms are created according to the list of predefined buckets for the measurement values. This list is controlled in step.properties by the following parameter:
# use following option to overwrite the default buckets (duration are in seconds)
# default is 0.005D, 0.01D, 0.025D, 0.05D, 0.075D, 0.1D, 0.25D, 0.5D, 0.75D, 1.0D, 2.5D, 5.0D, 7.5D, 10.0D
plugins.measurements.prometheus.buckets=0.01D,0.025D,0.05D,0.1D,0.25D,0.5D,1.0D,2.5D,5D,10D,25D,50D
Here for example the first bucket is set for all measurement values below 10ms, the second for values between 10ms and 25ms and so on. Bucket granularity can be adjusted by the user as needed.
Once a new execution is running, you will be able to see the data exposed by Step at the CONTROLLER_URL/metrics endpoint, as well as see the ingested data at the Prometheus PROMETHEUS_URL/graph endpoint.
Log
Step can generate data in a log format compatible with Splunk. To enable the Logback plugin in step.properties, enable the following property:
plugins.LogMeasurementControllerPlugin.enabled=true
The log configuration is controlled by the CONTROLLER_DIR\bin\logback.xml file, which by default looks like the following:
<appender name="MEASUREMENTS" class="ch.qos.logback.core.rolling.RollingFileAppender">
	<file>../log/measurement-logger.log</file>
	<rollingPolicy class="ch.qos.logback.core.rolling.FixedWindowRollingPolicy">
		<fileNamePattern>../log/measurement-logger-%i.log
		</fileNamePattern>
		<minIndex>1</minIndex>
		<maxIndex>2</maxIndex>
	</rollingPolicy>
	<triggeringPolicy
			class="ch.qos.logback.core.rolling.SizeBasedTriggeringPolicy">
		<maxFileSize>1GB</maxFileSize>
	</triggeringPolicy>
	<encoder>
		<pattern>{"timestamp":"%date","method":"%method","msg":%msg}%n</pattern>
	</encoder>
</appender>
Log files are stored in the directory set inside the <file> tag, by default CONTROLLER_DIR\log\measurement-logger.log. This configuration may be tuned by the user as required.
Grafana integration within step
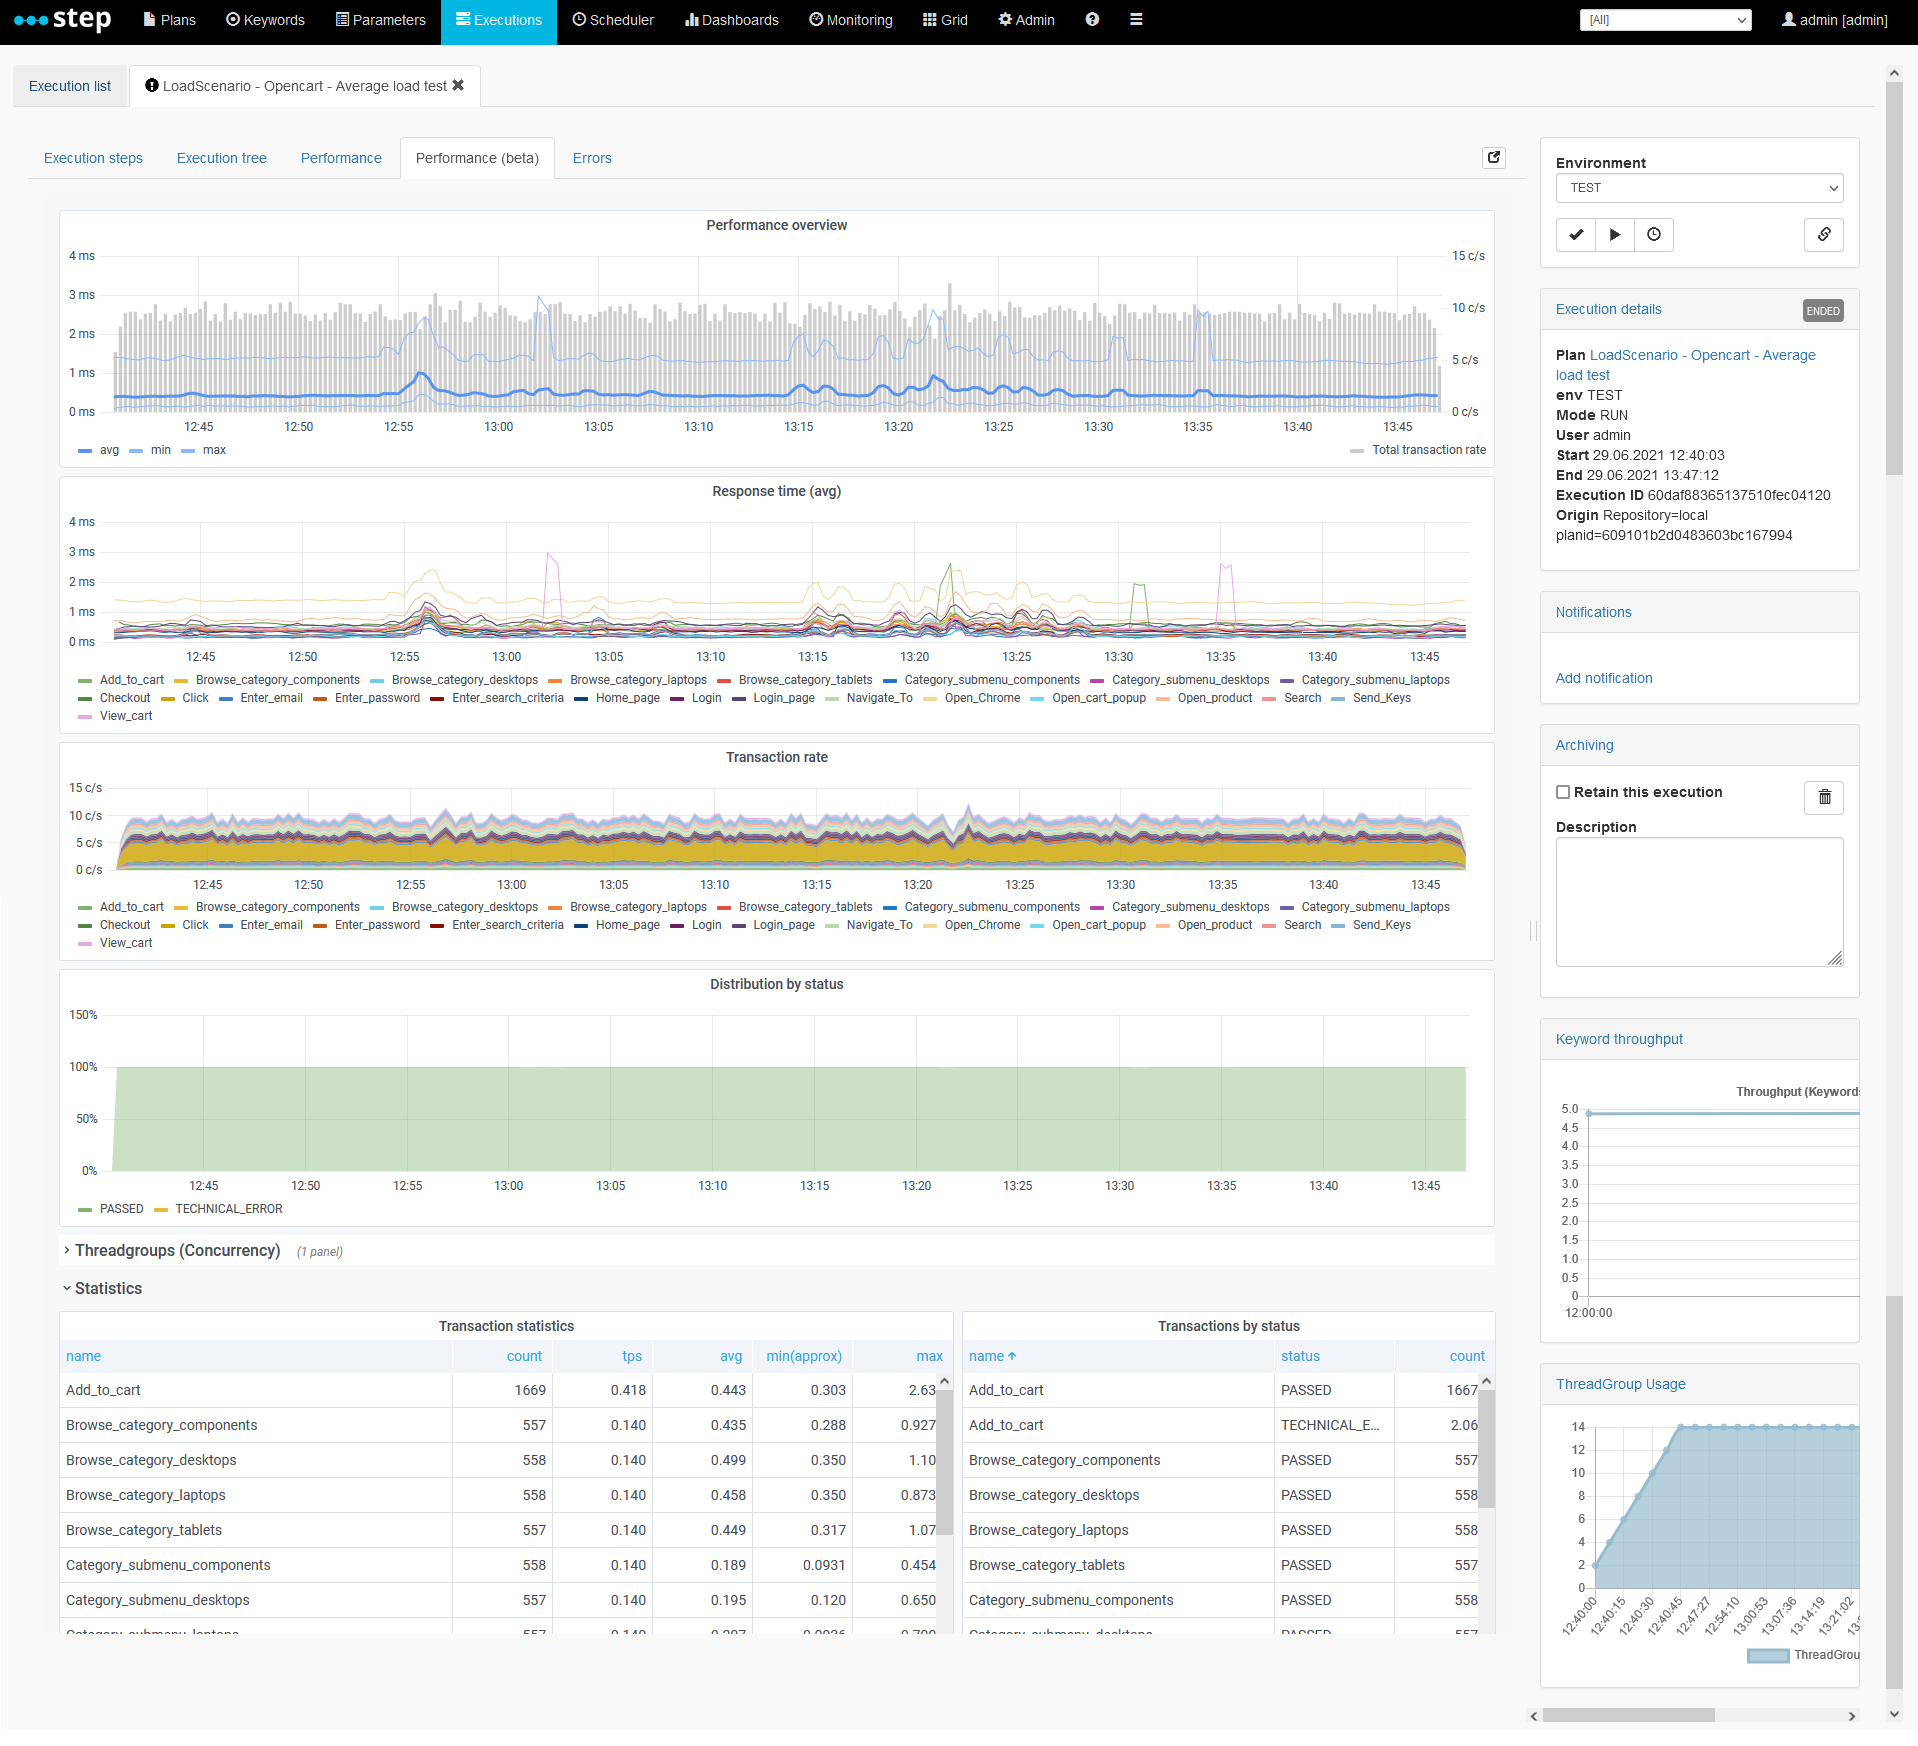
If you enable the grafana plugins you will be able to visualize the configured dashboard under the “Execute > dashboards” menu entry. Here is an example of the performance dashboard designed for performance and load testing:
Configuration requirements
If you don’t have a grafana server or haven’t imported our dashboards yet, you may want to follow the related tutorial. Mainly the section related to the installation of grafana, setup of the prometheus data source and the import of the dashboards are relevant in this case.
Dashboards part of the integration:
Grafana
In order to integrate the grafana dashboards in the Step web UI, following configuration changes are required in your grafana server configuration file (defaults.ini).
# set to true if you want to allow browsers to render Grafana in a <frame>, <iframe>, <embed> or <object>. default is false.
allow_embedding = true
# The full public facing url
root_url = %(protocol)s://%(domain)s:%(http_port)s/grafana
# Serve Grafana from subpath specified in `root_url` setting. By default it is set to `false` for compatibility reasons.
serve_from_sub_path = true
Step controller
In the step.properties configuration file, following section corresponds to the plugin configuration. While most properties default values should be used, you will most likely need to set the url of your grafana server and the authentication parameters (either user/password or api key).
#-----------------------------
# Grafana plugin
#-----------------------------
plugins.GrafanaPlugin.enabled=true
# Note: on recent grafana version, iframe support must be enabled in grafana ini file: allow_embedding = true
# Base url to grafana server (default: http://localhost:3000)
#plugins.grafana.baseUrl=http://localhost:3000

# An embedded proxy can be used for authentication and avoid CORS issue, but in this case a sub_path must be used.
plugins.grafana.embeddedProxy=true
# Modify grafana ini file to set serve_from_sub_path to true and add the below sub_path to the root_url, and uncomment:
plugins.grafana.subPath=/grafana

# Except is grafana is running with anonymous support, one of the following authentication methods shall be used
#   for the grafana api (retrieving dashboards URL) and for the embedded proxy
# API key
#plugins.grafana.apiKey=Bearer [token]
# Basic auth
#plugins.grafana.user=user
#plugins.grafana.pwd=pwd

### Dashboard configuration
#mongo embedded
#plugins.grafana.dashboard.execution=cbPJX1Rnk
#promethues embedded
plugins.grafana.dashboard.execution=RQqxcxg7k
plugins.grafana.dashboard.task=3JB9j357k
Note: the 2 last properties determine the default dashboards used for the execution performance dashboard and for the scheduled execution dashboard which are based on the prometheus datasource. You may change these settings to use dashboards meant for other datasources or to use your own dashboards.
Analyzing and visualizing data using Grafana
Data generated by Step and written to external databases may be attached as data sources to other analytical or monitoring tools. We provide example Grafana dashboards, which allow for visualizing Step data stored in MongoDB, PostgreSQL and Prometheus. Each of these dashboards contains a set of standard MongoDB / SQL / PromQL queries, which can be further re-used by the user as a starter to write more advanced queries.
See the tutorial for instructions on connecting Grafana to Step data sources.