Grafana K6 Plugin
Grafana K6 is an open-source load testing tool developed by Grafana.
K6 scripts can be executed in Step via the Grafana K6 Plugin, available to Step enterprise customers. This page describes how to install, configure and use the Grafana K6 plugin for Step.
Installation
Before using this plugin, Grafana K6 has to be installed on the machine running your agents.
By default, the k6 executable will be launched from your ${PATH}. You can define another installation folder by using the following property in the configuration file of your agent:
plugins.k6.folder: "C:\\Program Files\\k6\\"
Usage
Basic keyword configuration
When K6 is installed, you can easily run your script by creating a new keyword and uploading your js file:

You can also upload a zip file if your script is composed of modules:

Three basic options are visible by default:
- Iterations: defining the total number of iterations to run your script
- Duration: defining the total duration of your script. Note that the duration should include a suffix indicating the time unit (like ’10s’ or ‘5m’)
- Virtual Users (VUs): defining the number of VUs to run concurrently
Advanced options
It is also possible to controller the options passed to the k6 process via the Other Grafana K6 options dropdown:
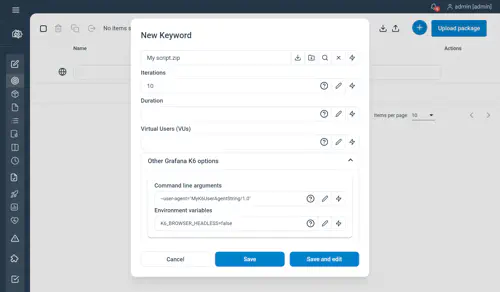
This screen allows you to define options via:
- Command lines: in this example, we override the default user agent
- Environment variables: some options can only be passed as environment variables. In this case, we change the Headless option of the browser
Activating the debug mode
The debug mode can be activated by setting a parameter named debug to true or full:
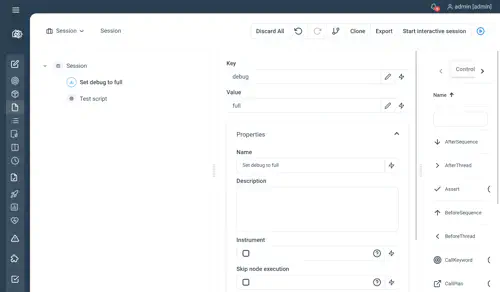
This will activate the debug for Http scripts and browser based scripts
Keyword Output
When executing a K6 keyword, the following results will be available in Step
- In case of error, the stdOut and stdError will be attached to the execution
- If debug is activated, a debug.log file will be attached
- If your browser-based keyword generated screenshots, these files will also be attached to the execution
- Finally, the following metrics will be collected and available in the analytics dashboard
- trend
- gauge
- rate
- counter
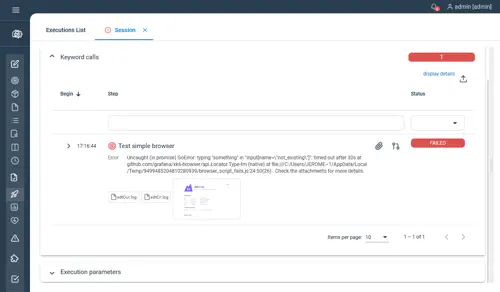
For example, below is the result of an successful execution with debug activated:

Another example with a browser-based keyword, including a screenshot and an error: